

How to Turn Substack Data Into Stories That Grow Your Audience
Turn insights from your posts into stories that resonate and convert


Most analytics tools tell you what happened. Substack Control Center goes a step further: it helps you see why posts grow your audience or cause churn and what to do next.
tested it for the first time, paired the report with ChatGPT for structured feedback, and within a few hours turned raw metrics into a polished story that resonated with thousands on Code Like a Girl.
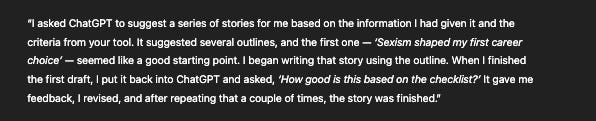
“I got your email with step-by-step instructions to analyze my stories, and the feedback was fascinating. I asked ChatGPT to build a checklist I could use for future drafts.
That same day, I started writing a story for Code Like a Girl and realized I was making the exact mistakes the feedback had flagged — too long, too diary-like, no clear call to action. So I dropped the draft into ChatGPT and asked if it should be split into separate stories. It suggested a series and even outlined them for me.
I picked the first one, wrote it, and ran it back through ChatGPT with the checklist. After a few quick iterations, I had one of the strongest stories I’ve written in years.
I’ve been writing and editing for years, but this was the first time it felt like I had my own editor — someone working through the story with me.”
— Dinah
That short message contains everything I want to celebrate:
✅ A customer who wants to do an experiment
✅ An easy onboarding email is doing its job
✅ A simple, repeatable writer + AI workflow that turns data and posts into publishable, highly engaging stories
Her process wasn’t magic - it’s something any Substack writer can follow in just three steps.
Why is this useful
Onboarding turns interest into action. Dinah had the tool installed but only started using it after a simple email walked her through the steps - clear guidance brought real results.
A repeatable writing loop. Data → Idea → Draft → Edit. Each cycle builds on the last, with analytics providing the insight and AI delivering feedback.
Growth-focused insights. By analyzing actual conversion metrics, writers can see which stories drive signups vs. churn - and quickly adjust to publish more of what works.
A simple 3-step workflow to copy
Step 1 — Setup
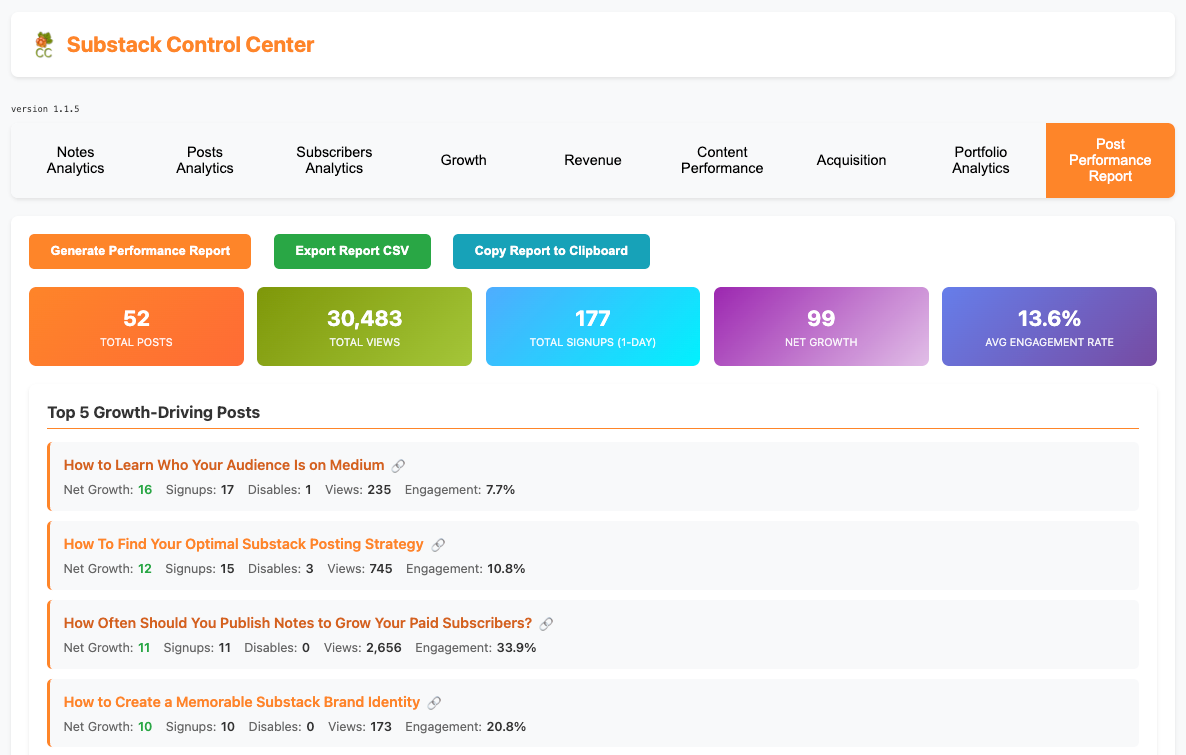
Install the Substack Control Center tool (v1.1.5 or later) and load your posts/notes data.
Click the Post Performance Report, generate the report, and open ChatGPT in another window.
Step 2 — Generate story ideas from the report
Copy the prompt below into ChatGPT.
Use the Copy Report to Clipboard feature, paste the report below the prompt, then hit enter.
You’ll get a detailed analysis of your growth vs. churn patterns.
📊 Growth Analysis Prompt

You are an expert in newsletter growth, engagement analytics, and content strategy. I will provide you with performance data from  Substack posts.

Your task is to deeply analyze this dataset and provide actionable insights.

Goals:

Identify why certain posts drive growth (signups > disables) while others cause churn.

Suggest how to improve my content to consistently drive higher growth.

Recommend strategies to increase views and engagement across all posts.

Instructions

Please analyze the dataset and structure your response into the following sections:

1. Growth Drivers vs. Churn Drivers

Compare top growth-driving vs. churn-driving posts.

Identify specific themes, formats, tones, or structures that correlate with growth or churn.

Explain why some posts convert readers into subscribers while others trigger unsubscribes.

2. Content Improvement Opportunities

Recommend how to optimize topics, style, structure, and CTAs to reduce churn and maximize signups.

Highlight “content gaps” — topics or formats I should publish more often (or avoid).

Suggest how churn-prone posts could be reframed into growth drivers.

3. Views & Engagement Growth

Suggest strategies to increase visibility (SEO, headlines, timing, distribution).

Recommend techniques to raise engagement beyond the current 13.7% average.

Explain how to convert high-engagement but low-growth posts into signup drivers.

4. Patterns Across Post Types

Evaluate performance by content type (tutorials, guides, personal stories, announcements, experiments, etc.).

Identify which categories consistently bring growth vs. churn.

Recommend an optimal content mix.

5. Actionable Takeaways

Provide 5–7 clear, specific, and actionable steps I can apply immediately to grow my Substack more effectively.

⚡ Use direct comparisons, metrics, and examples from the dataset to back up your recommendations. Include both diagnosis (why something worked/didn’t work) and prescription (what to do next).

Dataset -  now here is the report:
<PASTE REPORT>
Step 3 — Iterate & publish
This is what Dinah did next:
In summary
Apply the edits.
Re-run the checklist review.
Polish the story and headline.
Publish.
Then use the Post Performance Report to measure whether your story drives growth or churn.
Dinah followed these steps and ended up with this great story published in Code Like a Girl.

That’s precisely the kind of result I want this tool + workflow to deliver: easier publishing, sharper stories, and measurable impact on audience growth.
These example comments show how the story resonated deeply with her audience:


Final Thoughts
What I love most about Dinah’s story is how simple the process really was: a tool + a prompt + a feedback loop. She didn’t need to overthink it or spend weeks polishing — follow the steps, iterate, and publish.
If you want to try the same workflow for your own Substack, you’ll need the Substack Control Center. Version 1.1.5 introduces the Post Performance Report, providing growth vs. churn analysis that powers this process.
👉 Try Substack Control Center today and see which of your stories are secretly driving growth — and which are quietly causing churn.
Mind-boggling. Truly exemplary results by following the steps.
The lead image reminded me that when I was writing a post and my cat came around to visit. Eventually made her way to the keyboard and stopped my activity 😅