


Money, Mates, and Meaning Are All Moths to the Flame of Storytelling
The lessons I learned from Professor Scott Galloway’s last 7+ years

")
I am studying my favorite authors to learn from their stories.
Today, I focus on Scott Galloway. He has over 291K followers and has published 322 articles since May 9, 2017. He is a Professor of Marketing at NYU Stern School of Business and a host of Prof G and Pivot Podcasts. He is also the author of multiple books and has founded several companies since 1992.
I built a simple data pipeline that leverages Medium APIs to pull the details into a database. I created a dashboard to review the data and to tell Scott Galloway’s story in numbers.
So, what can we learn from Scott?
Consistency
Scott Galloway has published, on average, 1.3 articles per week since May 2017.
In his weekly column, No Mercy/No Malice, he shares various reflections on business, tech, and life on his mind.
Some of his earlier stories were initially published at www.l2inc.com, his digital intelligence firm founded in 2005.
He is a prolific writer but has taken a few breaks (probably vacations) over the years.
")
Content
Scott’s unvarnished, no-BS style is evident in his frequent business predictions, using numbers to make his points.
In his 2023 predictions, Scott talked about Big Tech layoffs:
The most consequential business strategy of 2023 won’t be AI or supply chain diversification, but being tough without being an asshole.
He explains the economic logic of these layoffs succinctly:
Google and Meta, with 30% operating margins, can either fire 25,000 people each or increase their top-line revenue by $12.5 billion and register the same operating income. They, and hundreds of other tech firms, will choose a version of the former.
")
Scott writes frequently on other topics, such as parenting, family, happiness, and relationships.
In his article Storytelling he shares this gem:
Cultivate an internal voice that tells you what’s flawed or missing in the popular discourse. People prefer a counter-narrative. Be the hunter who tracks straight to where the prey is actually hiding.
He starts the same article with this insight:
The weapon of mass attraction is the ability to communicate. I wish I’d figured this out earlier: Money, mates, and meaning are all moths to the flame of storytelling.
")
Here is Scott’s top 10 list of tags, followed by the number of articles using the tag:
No-mercy-no-malice (189)
Life-lessons (82)
Business (78)
Tech (56)
Technology (55)
Parenting (27)
Facebook (23)
Digital-marketing (20)
Social-media (18)
Economics (18)
Publications
Scott is not a big fan of publications.
About 30% of his posts were published in the Medium-owned Marker publication.
")
The bulk of his articles are just published directly by himself.
Marker was a Medium publication about the intersection of business, economics, and culture. It is currently inactive and not taking submissions. The last Scott’s story in Marker was published in March 2022.
")
Audience
I analyzed Scott’s 291,076 followers by extracting the words from their “bio” field and feeding them to the Wordcloud algorithm.
This method can provide some insights into his audience. Medium users who describe themselves using the words in the graph below have started following him.
In his followers’ bios, words like entrepreneur, business, digital marketing, designer, and tech enthusiast appear. This matches closely with the topics Scott is writing about.
")
Another interesting data point is his followers’ membership status and Medium joining date.
Scott’s followers are 92% non-members. From 2023 onward, we can see a growing trend for new Medium users starting to follow Scott Galloway.
")
Engagement
Scott’s engagement numbers, particularly claps, have had a lot of spikes.
He has multiple stories with 10K to 20K claps and frequently gets over 5K claps.
He has six stories with over 100 responses and 60 with zero responses, yet many claps. I read a few stories with zero responses but hundreds of claps, like this one. He is mixing business news with stories of his two young sons in a unique way:
CNBC is less business television than catheter television. The average age of the CNBC viewer is 67. Since my sons are eight and 11, that means there were two viewers in Osaka or the San Ysidro Valley (two “blue zones”) aged 122 and 127. The typical viewer of CNBC is a guy and his oxygen tank, wondering if he should buy or sell Amazon for his 401(k).
— Scott Galloway
")
Scott’s engagement with publications tells another exciting story.
While he has published only one story in OneZero, 13% of his claps come from that one. Likewise, the single story published in GEN represents 11% of claps from publications.
")
Below is the list of the top 10 stories by engagement metrics.
")
Weekly Schedule
Monday, Friday, and Tuesday are the most common days of the week when Scott clicks the “Publish” button.
")
Publishing Schedule
Since 2022, Scott has been residing in London.
His publishing schedule between 2017 and 2021 is on the graph below. His peak publishing hours were 14:00 UTC, 18:00 UTC, and 21:00 UTC.
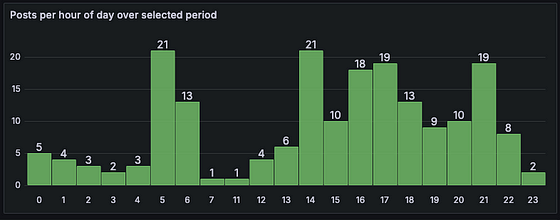
Between 2022 and 2024, he has published mainly during evening hours in the UK.

Final Thoughts
I love working with data.
I built an automated pipeline to pull all this data for a given Medium author into a database. The dashboard allows me to quickly review their best-performing stories and visualize what kind of patterns I can discover from the data.
As for insights, Scott Galloway’s data speaks for itself:
Consistency —Scott has written an average of about 1.3 weekly articles since May 2017.
Content — Scott’s unvarnished, no-BS style is evident in his frequent business predictions, using numbers to make his points. He writes frequently on other topics, such as parenting, family, happiness, and relationships.
Engagement — he has over 291K followers, over 495K claps, and 5K responses for his stories. He is attracting many new Medium users, and 92% of his followers are non-members.
Weekly Schedule — he publishes his stories typically on Monday, Friday, and Tuesday.
Publishing schedule — his peak publishing hours were 14:00 UTC, 18:00 UTC, and 21:00 UTC before 2022. After moving to London in 2022, he has published primarily after 6 PM local time.
Would you like to have such a dashboard?
You can grab the data used in this article from The Top Authors’ Dashboard for FREE.

Very cool! I love the deep insights! How did you build your pipeline?
I also build a (free) analytics tool. Honestly, I am surprised how much data Medium shares via their Graphql API 🙈
Feel free to check it out: https://www.medium-insights.com/