

Stop Flying Blind: Get Data-Driven Growth Insights for Your First 500 Subscribers

The Problem: Growth Feels Random

Substack’s dashboard tells you subscriber counts and post views. But it doesn’t answer the questions that keep you up at night:
“Why isn’t my content getting engagement?”
“Which posts are actually driving growth?”
“Am I publishing enough? Too much?”
“Where are my subscribers coming from?”
“What’s working and what’s not?”
You’re flying blind without data. You’re guessing instead of making decisions.
The StackContacts advantage: With your raw data locally, you can answer these questions in minutes - not hours of manual spreadsheet work.
You can grab your copy of the StackContacts tool - only $19 one-time fee to get detailed insights into your Substack data and start growing!
StackContacts newsletter will help you turn your subscriber data into revenue. To receive new posts and support my work, consider becoming a free or paid subscriber.
Ready-to-Use StackContacts AI Prompt
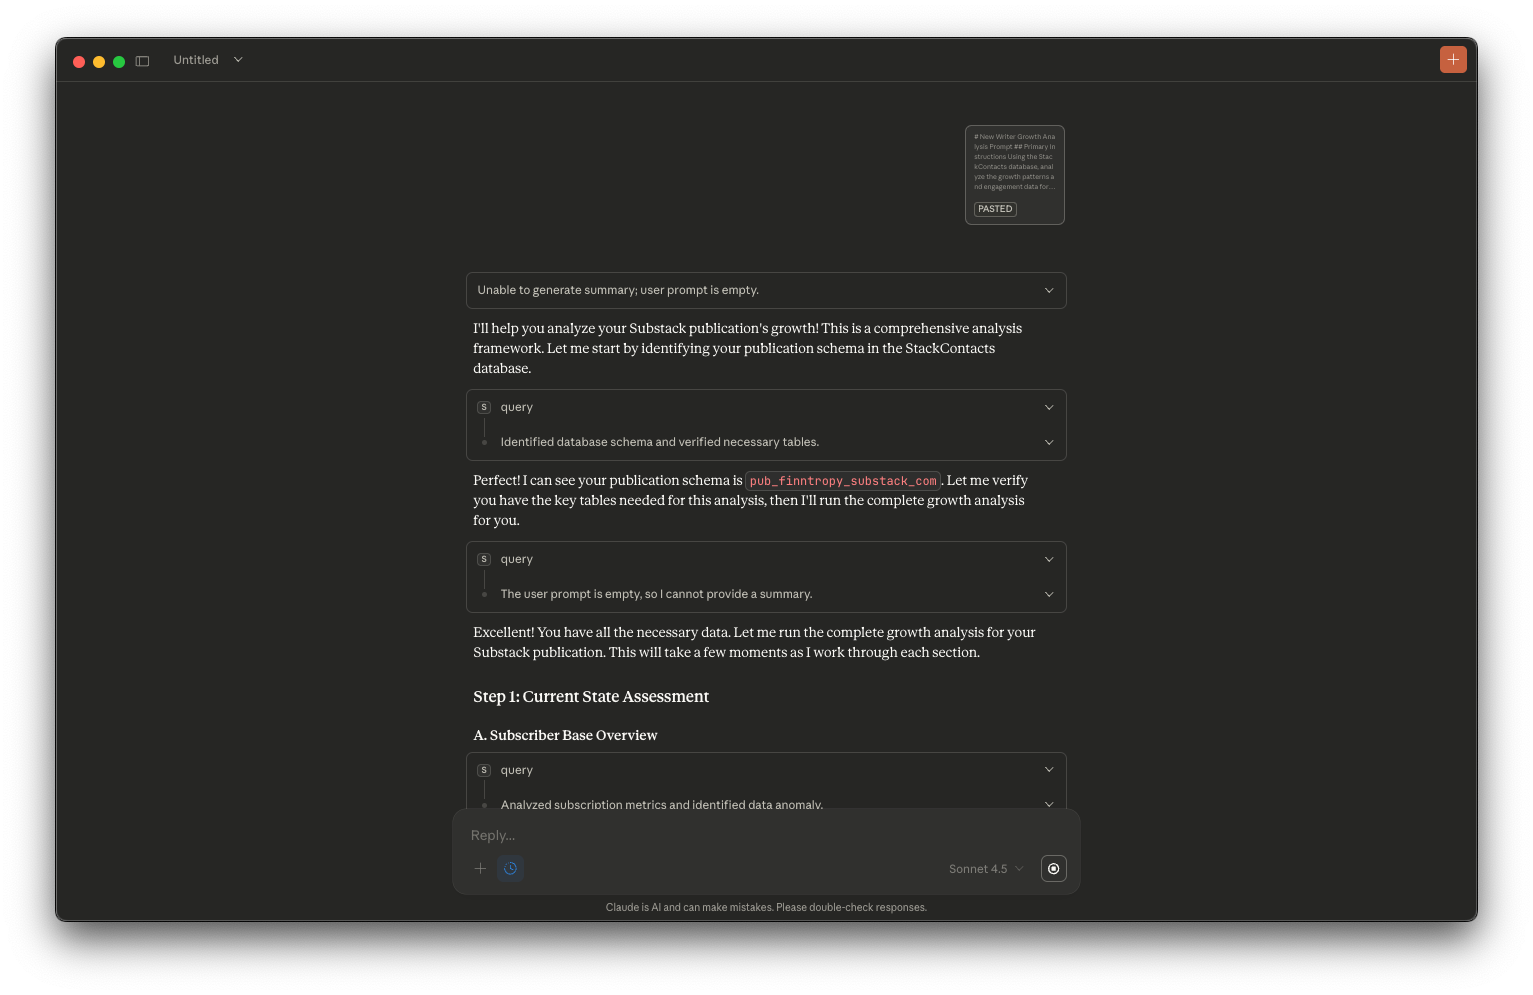
Copy the prompt below, replace [publication] with your publication name, and paste it into Claude (Cursor IDE or Claude Desktop) connected to your StackContacts database.
To find your schema name: Ask Claude, “What tables are in my StackContacts database? Show me the full table names with schema prefix.”
Your schema follows the pattern: pub_[your_publication]_substack_com
# New Writer Growth Analysis Prompt
## Primary Instructions
Using the StackContacts database, analyze the growth patterns and engagement data for a new writer with less than 100 subscribers. Identify what's working, what's not working, compare to successful growth patterns, and provide concrete, actionable recommendations to help them grow from zero to their first 100 subscribers.
Your analysis should be empathetic, address the specific pain points new writers face (distribution struggles, no interaction, confusion about growth, feeling like they're flying blind), and provide data-driven insights with clear next steps.
---
## INPUTS: [publication] use [your publication schema name]
## Parameters: None (analyzes all subscribers and content)
**IMPORTANT - Schema Customization:**
Before using this prompt, you must replace `[publication]` with your actual schema name.
- Your schema follows the pattern: `pub_[your_publication]_substack_com`
- To find your schema: Ask Claude "What tables are in my StackContacts database? Show me the full table names with schema prefix."
- Replace all instances of `[publication]` in the queries below with your schema name.
**IMPORTANT - Database Syntax:**
- This prompt uses DuckDB syntax. Date functions use `CURRENT_TIMESTAMP - INTERVAL 'X days'` format
- The `subscriber_events` table only has `subscriber_email` column (not `email`)
- Use `CURRENT_TIMESTAMP` for date comparisons, not `CURRENT_DATE`
---
## Step 1: Current State Assessment
### A. Subscriber Base Overview
Understand the current subscriber situation:
```sql
-- Current Subscriber Base Overview
SELECT
COUNT(*) as total_subscribers,
COUNT(CASE WHEN is_subscribed = True THEN 1 END) as active_subscribers,
COUNT(CASE WHEN is_subscribed = False THEN 1 END) as inactive_subscribers,
COUNT(CASE WHEN membership_state = 'free_signup' THEN 1 END) as free_subscribers,
COUNT(CASE WHEN membership_state LIKE '%paid%' THEN 1 END) as paid_subscribers,
MIN(created_at) as first_subscriber_date,
MAX(created_at) as most_recent_subscriber_date,
DATEDIFF('day', MIN(created_at), CURRENT_TIMESTAMP) as days_since_first_subscriber,
ROUND(COUNT(*) * 1.0 / NULLIF(DATEDIFF('day', MIN(created_at), CURRENT_TIMESTAMP), 0), 2) as avg_subscribers_per_day
FROM [publication].subscribers_detail;
Extract:
Total subscriber count
Active vs. inactive breakdown
Free vs. paid breakdown
How long they've been publishing
Average subscribers per day
### B. Growth Trajectory
Analyze growth over time:
-- Growth Trajectory Analysis
WITH monthly_subscribers AS (
SELECT
DATE_TRUNC('month', created_at) as month,
COUNT(*) as new_subscribers
FROM [publication].subscribers_detail
GROUP BY DATE_TRUNC('month', created_at)
)
SELECT
month,
new_subscribers,
SUM(new_subscribers) OVER (ORDER BY month) as cumulative_subscribers,
LAG(new_subscribers) OVER (ORDER BY month) as previous_month,
CASE
WHEN LAG(new_subscribers) OVER (ORDER BY month) IS NOT NULL
THEN ROUND((new_subscribers - LAG(new_subscribers) OVER (ORDER BY month)) * 100.0 /
NULLIF(LAG(new_subscribers) OVER (ORDER BY month), 0), 2)
ELSE NULL
END as month_over_month_growth_pct
FROM monthly_subscribers
ORDER BY month DESC;
**Extract:**
- Monthly subscriber growth
- Cumulative growth over time
- Month-over-month growth rate
- Growth trends (accelerating, steady, declining)
### C. Content Publishing Activity
Assess content output:
-- Content Publishing Activity
SELECT
COUNT(*) as total_posts,
COUNT(CASE WHEN post_date >= CURRENT_TIMESTAMP - INTERVAL '30 days' THEN 1 END) as posts_last_30d,
COUNT(CASE WHEN post_date >= CURRENT_TIMESTAMP - INTERVAL '7 days' THEN 1 END) as posts_last_7d,
MIN(post_date) as first_post_date,
MAX(post_date) as last_post_date,
DATEDIFF('day', MIN(post_date), CURRENT_TIMESTAMP) as days_since_first_post,
ROUND(COUNT(*) * 1.0 / NULLIF(DATEDIFF('day', MIN(post_date), CURRENT_TIMESTAMP), 0), 2) as avg_posts_per_day,
ROUND(COUNT(*) * 1.0 / NULLIF(DATEDIFF('day', MIN(post_date), CURRENT_TIMESTAMP), 0) * 7, 2) as avg_posts_per_week,
SUM(stat_views) as total_views,
SUM(reaction_count) as total_reactions,
SUM(comment_count) as total_comments,
ROUND(AVG(stat_views), 1) as avg_views_per_post,
ROUND(AVG(reaction_count), 1) as avg_reactions_per_post
FROM [publication].substack_posts;
**Extract:**
- Total posts published
- Recent publishing frequency
- Publishing consistency
- Average engagement metrics
- Views, reactions, comments per post
---
## Step 2: Engagement Analysis
### A. Subscriber Engagement Levels
Understand how engaged current subscribers are:
-- Subscriber Engagement Levels
WITH subscriber_engagement AS (
SELECT
sd.email,
sd.created_at as subscriber_since,
COUNT(se.event_id) as total_events,
COUNT(DISTINCT se.post_title) as posts_engaged,
COUNT(CASE WHEN se.text LIKE '%Clicked link%' OR se.text LIKE '%clicked%' THEN 1 END) as link_clicks,
COUNT(DISTINCT DATE(se.timestamp)) as active_days,
MIN(se.timestamp) as first_engagement,
MAX(se.timestamp) as last_engagement,
DATEDIFF('day', MAX(se.timestamp), CURRENT_TIMESTAMP) as days_since_last_engagement
FROM [publication].subscribers_detail sd
LEFT JOIN [publication].subscriber_events se ON sd.email = se.subscriber_email
GROUP BY sd.email, sd.created_at
)
SELECT
COUNT(*) as total_subscribers,
COUNT(CASE WHEN total_events = 0 THEN 1 END) as never_engaged,
COUNT(CASE WHEN total_events > 0 AND total_events <= 2 THEN 1 END) as low_engagement,
COUNT(CASE WHEN total_events > 2 AND total_events <= 10 THEN 1 END) as medium_engagement,
COUNT(CASE WHEN total_events > 10 THEN 1 END) as high_engagement,
ROUND(AVG(total_events), 1) as avg_events_per_subscriber,
ROUND(AVG(posts_engaged), 1) as avg_posts_engaged,
ROUND(AVG(link_clicks), 1) as avg_link_clicks,
ROUND(AVG(active_days), 1) as avg_active_days,
ROUND(AVG(days_since_last_engagement), 1) as avg_days_since_last_engagement
FROM subscriber_engagement;
**Extract:**
- Engagement distribution (never, low, medium, high)
- Average engagement metrics
- How many subscribers are actually reading
- Days since last engagement
### B. Content Performance Analysis
Identify which content resonates:
-- Content Performance Analysis
SELECT
title,
post_date,
stat_views,
reaction_count,
comment_count,
ROUND(reaction_count * 100.0 / NULLIF(stat_views, 0), 2) as reaction_rate_pct,
ROUND(comment_count * 100.0 / NULLIF(stat_views, 0), 2) as comment_rate_pct,
COUNT(DISTINCT se.subscriber_email) as unique_engagements,
COUNT(CASE WHEN se.text LIKE '%Clicked link%' OR se.text LIKE '%clicked%' THEN 1 END) as link_clicks
FROM [publication].substack_posts sp
LEFT JOIN [publication].subscriber_events se ON sp.title = se.post_title
GROUP BY title, post_date, stat_views, reaction_count, comment_count
ORDER BY stat_views DESC
LIMIT 20;
Extract:**
- Top 20 posts by views
- Engagement rates (reactions, comments)
- Which posts drive link clicks
- Content that resonates vs. doesn't
### C. Subscriber Acquisition Sources
Understand where subscribers come from:
-- Subscriber Acquisition Analysis
SELECT
CASE
WHEN free_attribution LIKE '%substack-signup-flow%' OR source LIKE '%substack-signup-flow%' THEN 'Substack Signup Flow'
WHEN free_attribution LIKE '%substack-notes%' OR source LIKE '%substack-notes%' THEN 'Substack Notes'
WHEN free_attribution LIKE '%substack-app%' OR source LIKE '%substack-app%' THEN 'Substack App'
WHEN free_attribution LIKE '%substack-reader-profile-discovery%' OR source LIKE '%substack-reader-profile-discovery%' THEN 'Substack Profile Discovery'
WHEN free_attribution LIKE '%google%' OR source LIKE '%google%' THEN 'Google Search'
WHEN free_attribution LIKE '%substack.com%' OR source LIKE '%substack.com%' THEN 'Substack.com Website'
WHEN free_attribution LIKE '%substack-follow-recommendations%' OR source LIKE '%substack-follow-recommendations%' THEN 'Substack Recommendations'
WHEN free_attribution LIKE '%direct%' OR source LIKE '%direct%' THEN 'Direct'
WHEN free_attribution LIKE '%substack-chat%' OR source LIKE '%substack-chat%' THEN 'Substack Chat'
WHEN free_attribution LIKE '%import%' OR source LIKE '%import%' THEN 'Import/Migration'
WHEN free_attribution LIKE '%substack-mentions%' OR source LIKE '%substack-mentions%' THEN 'Substack Mentions'
WHEN free_attribution LIKE '%post-end-cta%' OR source LIKE '%post-end-cta%' THEN 'Post End CTA'
WHEN free_attribution LIKE '%duckduckgo%' OR source LIKE '%duckduckgo%' THEN 'DuckDuckGo Search'
WHEN free_attribution IS NULL AND source IS NULL THEN 'Unknown'
ELSE 'Other'
END as acquisition_source,
COUNT(*) as subscriber_count,
ROUND(COUNT(*) * 100.0 / SUM(COUNT(*)) OVER (), 2) as percentage
FROM [publication].subscribers_detail
GROUP BY
CASE
WHEN free_attribution LIKE '%substack-signup-flow%' OR source LIKE '%substack-signup-flow%' THEN 'Substack Signup Flow'
WHEN free_attribution LIKE '%substack-notes%' OR source LIKE '%substack-notes%' THEN 'Substack Notes'
WHEN free_attribution LIKE '%substack-app%' OR source LIKE '%substack-app%' THEN 'Substack App'
WHEN free_attribution LIKE '%substack-reader-profile-discovery%' OR source LIKE '%substack-reader-profile-discovery%' THEN 'Substack Profile Discovery'
WHEN free_attribution LIKE '%google%' OR source LIKE '%google%' THEN 'Google Search'
WHEN free_attribution LIKE '%substack.com%' OR source LIKE '%substack.com%' THEN 'Substack.com Website'
WHEN free_attribution LIKE '%substack-follow-recommendations%' OR source LIKE '%substack-follow-recommendations%' THEN 'Substack Recommendations'
WHEN free_attribution LIKE '%direct%' OR source LIKE '%direct%' THEN 'Direct'
WHEN free_attribution LIKE '%substack-chat%' OR source LIKE '%substack-chat%' THEN 'Substack Chat'
WHEN free_attribution LIKE '%import%' OR source LIKE '%import%' THEN 'Import/Migration'
WHEN free_attribution LIKE '%substack-mentions%' OR source LIKE '%substack-mentions%' THEN 'Substack Mentions'
WHEN free_attribution LIKE '%post-end-cta%' OR source LIKE '%post-end-cta%' THEN 'Post End CTA'
WHEN free_attribution LIKE '%duckduckgo%' OR source LIKE '%duckduckgo%' THEN 'DuckDuckGo Search'
WHEN free_attribution IS NULL AND source IS NULL THEN 'Unknown'
ELSE 'Other'
END
ORDER BY subscriber_count DESC;
**Extract:**
- Where subscribers are coming from
- Which channels drive most growth
- Acquisition source distribution
---
## Step 3: Compare to Growth Benchmarks
### A. Publishing Frequency vs. Growth
Compare publishing frequency to subscriber growth:
-- Publishing Frequency vs. Growth Analysis
WITH monthly_metrics AS (
SELECT
DATE_TRUNC('month', sp.post_date) as month,
COUNT(DISTINCT sp.id) as posts_published,
COUNT(DISTINCT sd.email) as new_subscribers,
SUM(sp.stat_views) as total_views,
SUM(sp.reaction_count) as total_reactions
FROM [publication].substack_posts sp
FULL OUTER JOIN [publication].subscribers_detail sd
ON DATE_TRUNC('month', sp.post_date) = DATE_TRUNC('month', sd.created_at)
GROUP BY DATE_TRUNC('month', sp.post_date)
)
SELECT
month,
posts_published,
new_subscribers,
total_views,
total_reactions,
ROUND(new_subscribers * 1.0 / NULLIF(posts_published, 0), 2) as subscribers_per_post,
ROUND(total_views * 1.0 / NULLIF(posts_published, 0), 1) as avg_views_per_post,
ROUND(total_reactions * 1.0 / NULLIF(posts_published, 0), 1) as avg_reactions_per_post
FROM monthly_metrics
WHERE month IS NOT NULL
ORDER BY month DESC;
**Extract:**
- Posts published per month
- New subscribers per month
- Subscribers per post ratio
- Views and reactions per post
- Correlation between frequency and growth
### B. Engagement Quality Assessment
Assess if engagement is translating to growth:
-- Engagement Quality Assessment
WITH post_engagement AS (
SELECT
sp.title,
sp.post_date,
sp.stat_views,
sp.reaction_count,
COUNT(DISTINCT se.subscriber_email) as unique_engagements,
COUNT(CASE WHEN se.text LIKE '%Clicked link%' OR se.text LIKE '%clicked%' THEN 1 END) as link_clicks
FROM [publication].substack_posts sp
LEFT JOIN [publication].subscriber_events se ON sp.title = se.post_title
GROUP BY sp.title, sp.post_date, sp.stat_views, sp.reaction_count
),
subscriber_growth AS (
SELECT
DATE_TRUNC('month', created_at) as month,
COUNT(*) as new_subscribers
FROM [publication].subscribers_detail
GROUP BY DATE_TRUNC('month', created_at)
)
SELECT
DATE_TRUNC('month', pe.post_date) as month,
COUNT(*) as posts_published,
SUM(pe.stat_views) as total_views,
SUM(pe.reaction_count) as total_reactions,
SUM(pe.unique_engagements) as total_engagements,
SUM(pe.link_clicks) as total_link_clicks,
COALESCE(sg.new_subscribers, 0) as new_subscribers,
ROUND(COALESCE(sg.new_subscribers, 0) * 100.0 / NULLIF(SUM(pe.unique_engagements), 0), 2) as engagement_to_subscriber_rate
FROM post_engagement pe
LEFT JOIN subscriber_growth sg ON DATE_TRUNC('month', pe.post_date) = sg.month
GROUP BY DATE_TRUNC('month', pe.post_date), sg.new_subscribers
ORDER BY month DESC;
**Extract:**
- Engagement metrics by month
- New subscribers by month
- Engagement-to-subscriber conversion rate
- Whether engagement is leading to growth
## Step 4: Identify Growth Barriers
### A. Content Distribution Analysis
Check if content is being shared/distributed:
-- Content Distribution Analysis
SELECT
sp.title,
sp.post_date,
sp.stat_views,
COUNT(DISTINCT se.subscriber_email) as unique_engagements,
COUNT(CASE WHEN se.text LIKE '%Clicked link%' OR se.text LIKE '%clicked%' THEN 1 END) as link_clicks,
COUNT(CASE WHEN se.text LIKE '%restack%' OR se.text LIKE '%share%' THEN 1 END) as shares,
ROUND(COUNT(DISTINCT se.subscriber_email) * 100.0 / NULLIF(sp.stat_views, 0), 2) as engagement_rate_pct
FROM [publication].substack_posts sp
LEFT JOIN [publication].subscriber_events se ON sp.title = se.post_title
GROUP BY sp.title, sp.post_date, sp.stat_views
ORDER BY sp.post_date DESC
LIMIT 20;
**Extract:**
- Recent posts and their performance
- Engagement rates
- Share/restack activity
- Whether content is reaching subscribers
### B. Subscriber Retention Analysis
Check if subscribers are staying engaged:
-- Subscriber Retention Analysis
WITH subscriber_lifecycle AS (
SELECT
sd.email,
sd.created_at as subscribed_date,
MIN(se.timestamp) as first_engagement,
MAX(se.timestamp) as last_engagement,
COUNT(se.event_id) as total_events,
DATEDIFF('day', sd.created_at, CURRENT_TIMESTAMP) as days_since_subscribed,
DATEDIFF('day', MAX(se.timestamp), CURRENT_TIMESTAMP) as days_since_last_engagement
FROM [publication].subscribers_detail sd
LEFT JOIN [publication].subscriber_events se ON sd.email = se.subscriber_email
GROUP BY sd.email, sd.created_at
)
SELECT
CASE
WHEN days_since_subscribed <= 7 THEN 'New (0-7 days)'
WHEN days_since_subscribed <= 30 THEN 'Recent (8-30 days)'
WHEN days_since_subscribed <= 90 THEN 'Established (31-90 days)'
ELSE 'Long-term (90+ days)'
END as subscriber_cohort,
COUNT(*) as subscriber_count,
COUNT(CASE WHEN total_events = 0 THEN 1 END) as never_engaged,
COUNT(CASE WHEN days_since_last_engagement <= 7 THEN 1 END) as active_last_7d,
COUNT(CASE WHEN days_since_last_engagement > 30 THEN 1 END) as inactive_30d_plus,
ROUND(AVG(total_events), 1) as avg_events,
ROUND(AVG(days_since_last_engagement), 1) as avg_days_since_engagement
FROM subscriber_lifecycle
GROUP BY
CASE
WHEN days_since_subscribed <= 7 THEN 'New (0-7 days)'
WHEN days_since_subscribed <= 30 THEN 'Recent (8-30 days)'
WHEN days_since_subscribed <= 90 THEN 'Established (31-90 days)'
ELSE 'Long-term (90+ days)'
END
ORDER BY
CASE
WHEN subscriber_cohort = 'New (0-7 days)' THEN 1
WHEN subscriber_cohort = 'Recent (8-30 days)' THEN 2
WHEN subscriber_cohort = 'Established (31-90 days)' THEN 3
ELSE 4
END;
**Extract:**
- Subscriber retention by cohort
- How many never engage
- Active vs. inactive subscribers
- Engagement patterns over time
### C. Content Topic Analysis
Identify which topics/content types perform best:
-- Content Topic Performance
WITH post_topics AS (
SELECT
sp.title,
sp.post_date,
sp.stat_views,
sp.reaction_count,
COUNT(DISTINCT se.subscriber_email) as unique_engagements,
CASE
WHEN LOWER(sp.title) LIKE '%how to%' OR LOWER(sp.title) LIKE '%guide%' THEN 'How-To/Tutorial'
WHEN LOWER(sp.title) LIKE '%why%' OR LOWER(sp.title) LIKE '%should%' THEN 'Strategy/Advice'
WHEN LOWER(sp.title) LIKE '%i %' OR LOWER(sp.title) LIKE '%my %' THEN 'Personal Story'
WHEN LOWER(sp.title) LIKE '%what%' OR LOWER(sp.title) LIKE '%which%' THEN 'Educational'
ELSE 'Other'
END as content_type
FROM [publication].substack_posts sp
LEFT JOIN [publication].subscriber_events se ON sp.title = se.post_title
GROUP BY sp.title, sp.post_date, sp.stat_views, sp.reaction_count
)
SELECT
content_type,
COUNT(*) as post_count,
ROUND(AVG(stat_views), 1) as avg_views,
ROUND(AVG(reaction_count), 1) as avg_reactions,
ROUND(AVG(unique_engagements), 1) as avg_engagements,
ROUND(SUM(stat_views), 0) as total_views
FROM post_topics
GROUP BY content_type
ORDER BY avg_views DESC;
**Extract:**
- Content types and their performance
- Which topics get most views
- Which topics drive engagement
- Content strategy insights
---
## Step 5: Growth Opportunity Identification
### A. High-Engagement Subscribers Analysis
Identify engaged subscribers who might help with growth:
-- High-Engagement Subscribers (Potential Advocates)
WITH subscriber_engagement AS (
SELECT
sd.email,
sd.created_at as subscribed_date,
COUNT(se.event_id) as total_events,
COUNT(DISTINCT se.post_title) as posts_engaged,
COUNT(CASE WHEN se.text LIKE '%Clicked link%' OR se.text LIKE '%clicked%' THEN 1 END) as link_clicks,
MAX(se.timestamp) as last_engagement,
DATEDIFF('day', MAX(se.timestamp), CURRENT_TIMESTAMP) as days_since_last_engagement
FROM [publication].subscribers_detail sd
LEFT JOIN [publication].subscriber_events se ON sd.email = se.subscriber_email
GROUP BY sd.email, sd.created_at
)
SELECT
email,
total_events,
posts_engaged,
link_clicks,
days_since_last_engagement,
CASE
WHEN total_events >= 10 AND posts_engaged >= 3 THEN 'Superfan - Ask for Referral'
WHEN total_events >= 5 AND link_clicks >= 1 THEN 'Engaged - Potential Advocate'
WHEN total_events >= 3 THEN 'Active - Build Relationship'
ELSE 'Monitor'
END as engagement_tier
FROM subscriber_engagement
WHERE total_events >= 3
ORDER BY total_events DESC
LIMIT 20;
**Extract:**
- Most engaged subscribers
- Potential advocates or referral sources
- Subscribers to build relationships with
### B. Content Gaps Analysis
Identify what content is missing:
-- Content Gaps Analysis
WITH all_posts AS (
SELECT
title,
post_date,
stat_views,
reaction_count,
COUNT(DISTINCT se.subscriber_email) as unique_engagements
FROM [publication].substack_posts sp
LEFT JOIN [publication].subscriber_events se ON sp.title = se.post_title
GROUP BY title, post_date, stat_views, reaction_count
)
SELECT
'Total Posts' as metric,
COUNT(*) as value
FROM all_posts
UNION ALL
SELECT
'Posts with 0 Views',
COUNT(CASE WHEN stat_views = 0 THEN 1 END)
FROM all_posts
UNION ALL
SELECT
'Posts with 0 Reactions',
COUNT(CASE WHEN reaction_count = 0 THEN 1 END)
FROM all_posts
UNION ALL
SELECT
'Posts with 0 Engagements',
COUNT(CASE WHEN unique_engagements = 0 THEN 1 END)
FROM all_posts
UNION ALL
SELECT
'Avg Views per Post',
ROUND(AVG(stat_views), 1)
FROM all_posts
UNION ALL
SELECT
'Avg Reactions per Post',
ROUND(AVG(reaction_count), 1)
FROM all_posts;
**Extract:**
- Content performance summary
- Posts with no engagement
- Average performance metrics
- Content quality issues
---
## Output Format
Structure your analysis as follows:
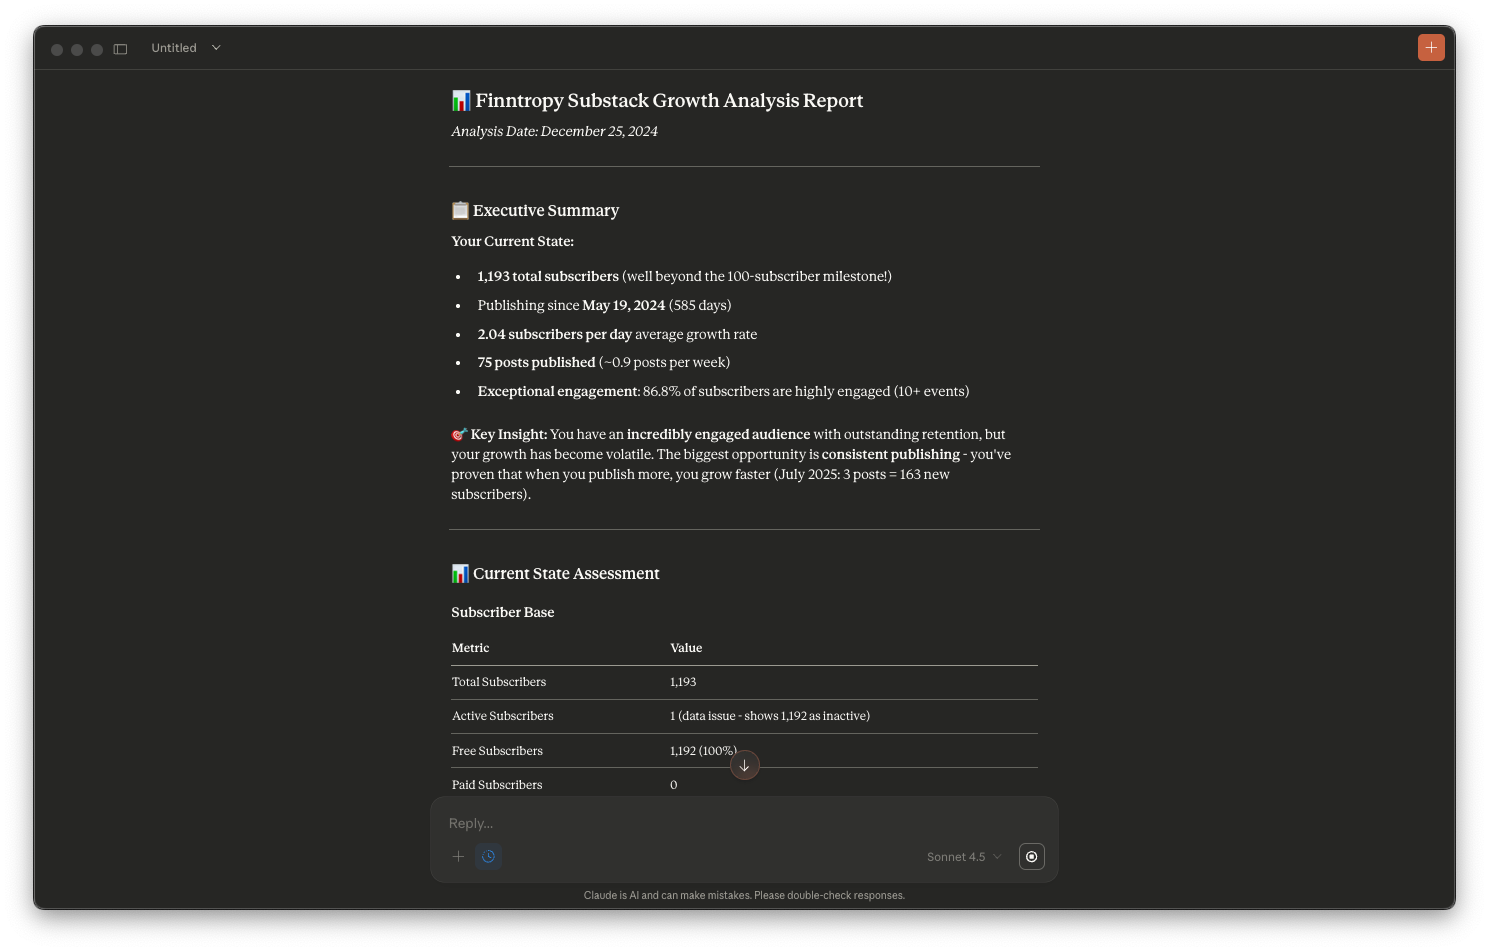
### 📋 Executive Summary
- Current subscriber count
- How long they've been publishing
- Average subscribers per day/week
- Key insight: What's the biggest growth barrier?
### 📊 Current State Assessment
**Subscriber Base:**
- Total subscribers, active vs. inactive
- Free vs. paid breakdown
- Days since first subscriber
- Growth rate (subscribers per day)
**Growth Trajectory:**
- Monthly subscriber growth table
- Cumulative growth over time
- Month-over-month growth rate
- Growth trend (accelerating, steady, declining, stalled)
**Content Publishing:**
- Total posts published
- Publishing frequency (posts per week)
- Publishing consistency
- Recent activity (last 7 days, 30 days)
**Key Insights:**
- Are they publishing consistently?
- Is growth steady or stalled?
- What's the current growth rate?
### 📈 Engagement Analysis
**Subscriber Engagement Levels:**
- Table: Engagement Tier, Subscriber Count, Percentage
- Never engaged, Low, Medium, High engagement breakdown
- Average events per subscriber
- Days since last engagement
**Content Performance:**
- Top 20 posts by views with engagement metrics
- Posts with highest engagement rates
- Posts with link clicks
- Content that resonates vs. doesn't
**Subscriber Acquisition:**
- Table: Acquisition Source, Subscriber Count, Percentage
- Where subscribers are coming from
- Which channels work best
- Unknown/direct vs. social media
**Key Insights:**
- What percentage of subscribers actually engage?
- Which content performs best?
- Where are subscribers coming from?
- Is engagement leading to growth?
### 🎯 Growth Barriers Identified
**Content Distribution:**
- Are posts being shared/restacked?
- Engagement rates
- Reach vs. subscriber count
- Distribution challenges
**Subscriber Retention:**
- Table: Subscriber Cohort, Count, Never Engaged, Active Last 7d, Inactive 30d+
- Retention by cohort (new, recent, established)
- Churn indicators
- Engagement patterns
**Content Strategy:**
- Content type performance (How-To, Strategy, Personal Story, etc.)
- Which topics drive engagement
- Content gaps (posts with 0 views/reactions)
**Key Insights:**
- What's preventing growth? (distribution, engagement, content quality)
- Are subscribers staying engaged?
- Which content types work best?
### 💡 Growth Recommendations
#### For Immediate Action (This Week)
**1. Fix Content Distribution (If Struggling)**
- **Problem:** "Writing isn't the hard part. Sharing it everywhere is."
- **Action:**
- Create a simple distribution checklist for each post
- Share on 2-3 platforms consistently (don't try to do all)
- Focus on platforms where you already have presence
- Use Notes to share post snippets
**2. Engage with Existing Subscribers**
- **Problem:** "No interaction :("
- **Action:**
- Respond to every comment personally
- Send welcome DMs to new subscribers
- Ask questions in posts to encourage engagement
- Create content based on subscriber questions
**3. Publish Consistently**
- **Problem:** "Growth feels random"
- **Action:**
- Set a realistic schedule (1-2 posts per week minimum)
- Stick to it for 30 days
- Track which days/times get most engagement
- Don't worry about perfection - consistency beats perfection
#### For Short-term Growth (This Month)
**4. Focus on One Content Type That Works**
- **Action:**
- Identify your top 3 performing posts
- Create more content like those
- If How-To posts work, write more tutorials
- If personal stories work, share more experiences
- Double down on what resonates
**5. Build Relationships with Engaged Subscribers**
- **Action:**
- Identify your 10 most engaged subscribers
- Send personal thank-you messages
- Ask for feedback on content
- Request referrals (if appropriate)
- Build a small community around engaged readers
**6. Optimize Content for Engagement**
- **Action:**
- Add clear questions at the end of posts
- Include CTAs that encourage comments
- Share personal stories that invite connection
- Make content shareable (clear takeaways)
#### For Long-term Growth (Next 3 Months)
**7. Establish Your Niche (If Needed)**
- **Problem:** "Do I really have to make my focus niche?"
- **Action:**
- Analyze which topics get most engagement
- Narrow focus to 2-3 related topics
- Become known for something specific
- You can still write broadly, but have a core focus
**8. Create a Content Series**
- **Action:**
- Develop a 4-6 post series on your best topic
- Reference previous posts in new ones
- Build momentum with connected content
- Series help with retention and referrals
**9. Leverage Substack Features**
- **Action:**
- Use Notes daily (even just 1-2 per day)
- Engage with other writers' Notes
- Comment on posts in your niche
- Restack valuable content
- Build relationships on-platform
**10. Track What Works**
- **Problem:** "Flying blind without data"
- **Action:**
- Track which posts drive new subscribers
- Note which topics get most engagement
- Monitor which distribution channels work
- Adjust strategy based on data, not guesses
### 🎯 Specific Growth Tactics
#### For Writers Starting from Zero
**Tactic 1: The "First 10" Strategy**
- Focus on getting your first 10 engaged subscribers
- Personal outreach to each one
- Build relationships before scaling
- Quality over quantity at this stage
**Tactic 2: Cross-Pollination**
- Engage with 5-10 other writers in your niche daily
- Comment meaningfully on their posts
- Restack valuable content
- Build relationships that lead to discovery
**Tactic 3: Value-First Content**
- Every post should solve a problem or share insight
- Make content shareable (clear takeaways)
- Write for your ideal reader, not everyone
- Focus on value, not volume
**Tactic 4: Consistency Over Perfection**
- Publish on schedule, even if not perfect
- 1 good post per week beats 0 perfect posts
- Build the habit of publishing
- Improve as you go
#### For Writers with Stalled Growth
**Tactic 1: Re-Engage Existing Subscribers**
- Send a "What do you want to read?" email
- Ask for feedback on recent posts
- Create content based on their requests
- Reactivate dormant subscribers
**Tactic 2: Analyze and Pivot**
- Identify your 3 worst-performing posts
- Stop creating that type of content
- Double down on your 3 best-performing posts
- Pivot strategy based on data
**Tactic 3: Distribution Audit**
- List all places you share content
- Identify which channels drive subscribers
- Focus on 2-3 channels that work
- Stop wasting time on channels that don't
**Tactic 4: Content Refresh**
- Update and republish top-performing old posts
- Turn one post into multiple Notes
- Create follow-up posts to popular content
- Build on what works
### ⚠️ Common Mistakes to Avoid
**Mistake 1: Publishing Inconsistently**
- **Problem:** "6 months of consistency, no progress" (but were they actually consistent?)
- **Solution:** Set realistic schedule and stick to it for 90 days minimum
**Mistake 2: Ignoring Existing Subscribers**
- **Problem:** "No interaction" - but are you engaging with them?
- **Solution:** Respond to comments, send DMs, ask questions
**Mistake 3: Trying to Do Everything**
- **Problem:** "Sharing it everywhere is" - too overwhelming
- **Solution:** Pick 2-3 distribution channels and master them
**Mistake 4: Writing for Everyone**
- **Problem:** "Do I really have to make my focus niche?"
- **Solution:** You don't need a tiny niche, but you need focus. Write for your ideal reader.
**Mistake 5: Comparing to Big Accounts**
- **Problem:** Feeling discouraged by others' success
- **Solution:** Focus on your own growth trajectory, not others' numbers
### 📊 Growth Benchmarks for <100 Subscribers
**Healthy Growth Indicators:**
- **Publishing:** 1-2 posts per week consistently
- **Engagement:** 20-30% of subscribers engage with content
- **Growth Rate:** 2-5 new subscribers per week
- **Retention:** 60%+ of subscribers engage within 30 days
**Warning Signs:**
- **0% engagement:** Subscribers aren't reading - check content quality
- **No growth for 30+ days:** Need to change strategy
- **High churn:** Subscribers leaving faster than joining
- **0 views on posts:** Distribution problem
---
## Analysis Style Guidelines
1. **Be empathetic:** Acknowledge the frustration ("I know it feels like you're flying blind...")
2. **Be specific:** Use exact numbers, percentages, and examples
3. **Be actionable:** Every insight should lead to a specific action
4. **Be encouraging:** Highlight what's working, not just what's broken
5. **Use their language:** Reference their pain points ("no interaction", "struggling with distribution")
6. **Prioritize:** Focus on 3-5 most important actions, not 20
7. **Format for readability:** Use tables, bullets, clear headers
---
## Quality Checklist
Before finalizing the analysis, ensure you've:
- [ ] Calculated current subscriber count and growth rate
- [ ] Analyzed publishing frequency and consistency
- [ ] Assessed subscriber engagement levels
- [ ] Identified top-performing content
- [ ] Analyzed subscriber acquisition sources
- [ ] Identified growth barriers
- [ ] Compared to benchmarks
- [ ] Provided specific, actionable recommendations
- [ ] Addressed common pain points (distribution, engagement, growth confusion)
- [ ] Made the analysis encouraging and empathetic
- [ ] Included specific next steps with timeframesHow to Use This Prompt
Step 1: Find Your Schema Name
In Claude connected to StackContacts, ask: “What tables are in my StackContacts database? Show me the full table names with schema prefix.”
Your schema follows the pattern: `pub_[your_publication]_substack_com`
Example: If you see `pub_myblog_substack_com.subscribers_detail`, your schema is `pub_myblog_substack_com`
Step 2: Replace `[publication]`
Use Find & Replace in your editor
Replace all instances of `[publication]` with your actual schema name (e.g., `pub_myblog_substack_com`)
Step 3: Paste into Claude
Open Claude in the Cursor IDE or the Claude Desktop
Make sure Claude is connected to your StackContacts database
Paste the entire prompt (including all SQL queries)
Wait 1-2 minutes for the analysis to complete
Step 4: Review and Act
Save the analysis to a file (e.g., `Growth_Analysis_[Date].md`)
Focus on the top 3-5 recommendations
Implement changes one at a time
Re-run monthly to track progress
What You’ll Get
This prompt analyzes:
✅ Your current subscriber base and growth trajectory
✅ Publishing frequency and consistency
✅ Engagement levels (who’s reading, who’s not)
✅ Content performance (which posts work, which don’t)
✅ Subscriber acquisition sources (where growth comes from)
✅ Growth barriers (what’s preventing growth)
✅ Specific, actionable recommendations
The analysis is empathetic, data-driven, and actionable. It addresses real pain points like distribution struggles, low engagement, and growth confusion—and gives you concrete next steps.
Key Takeaways
Stop guessing. Get data-driven insights about your growth
No SQL skills required. Just copy, paste, and get answers from Claude
Works with small audiences. Designed for writers with <500 subscribers
Actionable recommendations. Every insight leads to a specific action
Run monthly. Track your progress and adjust strategy
Try it now. Replace `[publication]` with your schema name and paste into Claude. You’ll have a complete growth analysis in minutes.
Questions? Please share your results in the comments or bring them to office hours. We’ll help you interpret your data and build a growth strategy that works.
— Finn
StackContacts is a reader-supported publication. To receive new posts and support my work, consider becoming a free or paid subscriber.