

How I Turned My Substack Posts into Dividend‑Paying Assets
My 4-Hour-a-Week Strategy for 1,900% Subscriber Growth and $8K in Revenue on Substack


You don’t need a finance degree to grow your Substack.
But if you treat every post like a lottery ticket, you’ll burn out.
What if, instead, you treated each one like a long-term asset?
I’ve posted hundreds of Notes and dozens of long-form stories on Substack. Some flopped. A few went viral.
But the real winners?
Quiet posts that kept working behind the scenes—earning shares, driving sign-ups, and bringing in revenue while I focused on my day job.
That’s when I had a realization:
What if your best-performing stories didn’t just go viral once, but kept working for you, week after week?
That’s what I discovered when I started treating my Substack like a portfolio—not a content treadmill.
Let me show you how I did it and how you can do it as well.
This isn’t a story about going viral or quitting my job. It’s a quiet, yet effective, compounding system I built while juggling a demanding 9-to-5 engineering job and family responsibilities.
Think like an investor, not a content machine
Writers and solopreneurs aren’t so different.
We both ship products. Some take off, some don't.
But over time, your catalog starts to work for you if you know what to look for.
Like any investor, I started asking:
🧭 Which of my posts are the "blue chips"?
🧨 Which ones are overhyped rockets?
🔥 Which ones quietly compound over time?
So, I did what any engineer would do:
I built a tool and ran a portfolio analysis on every Substack post I’ve ever published.
Why does portfolio analysis matter?
About 10 months ago, I ran a similar experiment on Medium after writing weekly for 18 months:

In it, I applied the investor mindset to story analytics and adjusted my strategy based on the results.
Back then, I started building simple Chrome extensions—nothing fancy.
I offered them for free and let people tip me if they found them useful.
Creators were literally paying me to learn.
What could be better than that?
As feedback rolled in, I began understanding my audience’s real pain points.
So I doubled down—writing how-to articles, building tools, and solving real problems inside my Finn’sights newsletter.
This led to the release of a few new digital products on Gumroad.
Results (10 months later)
Now, ten months later, I am looking at the results.
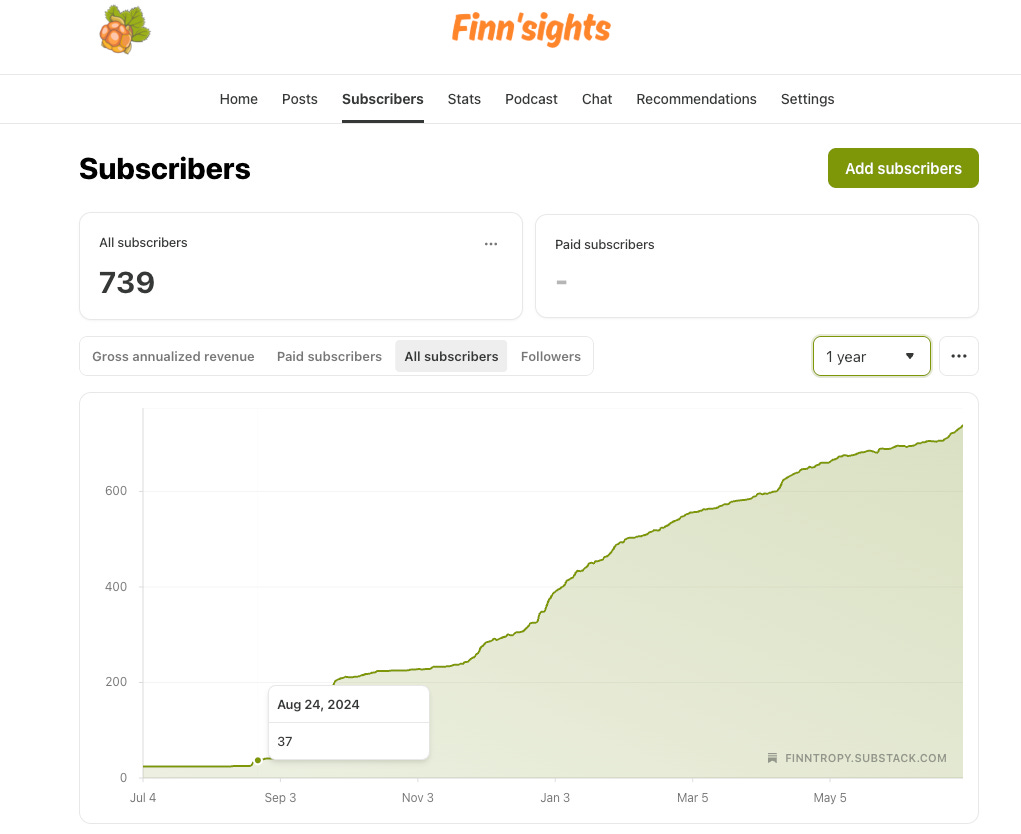
Newsletter subscribers: 37 → 739 (+1,897%)
Digital product revenue: $0 → just under $8,000
Total customers: Over 440 individual buyers
Pricing model: $5–$29, one-time purchase (no subscriptions, no ads)
No viral launch. No growth hacks.
Just useful tools, clear problems, and compounding trust.

The flop that taught me the most
Not everything I built worked.
One early product pre-sold 20 slots before I’d even finished it. I thought I had a hit until customers started canceling after I had them kick the tires.
That flop taught me more than the successes:
People will pay to test an idea, but that doesn’t mean they’ll use it
Pre-orders ≠ product-market fit
Feedback loops are faster (and cheaper) when you ship tiny, useful tools first
“Did This Take a Ton of Time?”
Not really.
I’m an engineer with a demanding 9-to-5 (more like 24/7 when I have on-call duty).
Most weeks, I only get 2–4 hours on weekends to work on Substack.
Some weeks, life gets in the way. No story, no shipping.
That’s why I’ve kept my newsletter free. I didn’t want the pressure of weekly publishing on top of the stress from my day job.
But even with a few hours a week, consistency + compounding still delivered results.
Metrics 101
When you write on Medium, you get paid based on a secret formula that changes every few years. Instead of trying to decipher their formula, I built a simple tool that grabs Medium's monthly revenue by story and categorizes them into different “asset” classes.
What do the Substack metrics mean?
Substack's revenue drivers are different, and there are various ways to monetize your writing. Some writers have paid subscriptions, some have sponsors, while others monetize the community using membership fees or offer group or 1:1 coaching.
So, I pulled every metric that Substack provides and turned them into signals.
Here’s how to read your Substack dashboard like an investor's “earnings report.”

These numbers don’t just measure performance. They hint at your leverage.
Some posts barely earn a click.
Others generate subscribers on autopilot.
That’s your compounding engine.
However, dealing with dozens of different metrics is confusing.
Since I’ve built a few tools to automate analysis before, I spent a few hours automating my portfolio analysis.
Visualizing your portfolio
I built a tool to import all my post data from Substack and chart it.

Each of my Substack posts is a digital asset, represented by a bubble with specific metrics.
Here's how I charted mine:
X-axis → Open Rate (%) = subject line strength
Y-axis → Free/Paid Subscriber Signups = conversion engine
Bubble Size → Reacts = emotional resonance
Then, I classified them using a simple formula:
🟢 Dividend Dynamos – evergreen compounding assets
🚀 Launch Rockets – go viral, fade fast
🔥 Slow Burners – steady performers
🎤 One-Hit Wonders – spike and disappear
I am calculating the P(75) of metric values (75th percentile), which means that only the top 25% of stories are considered Dynamos.
Your posts aren’t static assets; they can be rebalanced. What starts as a One-Hit Wonder can evolve into a Dynamo with the right tweaks. I added those date sliders that allow me to see how my posts are evolving over time.
My portfolio examples
The graph above immediately revealed a pattern - how my writing fell into these four “asset” classes:
1. Dividend Dynamos: 💰 High Open Rate + High Subscribes
These posts are my Substack blue chips. They compound quietly, month after month.
Example:

Open Rate: 38.2%
Free signups: 63
Reacts: 220
2. Launch Rockets: 🚀 Big Reaction, Low Staying Power
These go viral but don’t convert in the long term. Great for reach, weak on ROI.
Example:

Open Rate: 33.9%
Free signups: 1
Reacts: 28
3. Slow Burners: 🔥 Average metrics, but consistent over time
They might not spike, but they stick. These are the backbone of long-term reach.
Example:

Open Rate: 35.8%
Free signups: 43
Reacts: 168
4. One-Hit Wonders: 🎤 Spiked once. Never again.
Fun to write. Good learning experiences. But hard to monetize or build on.
Example:

Open Rate: 48.7%
Free signups: 0
Reacts: 4
My biggest surprise?
The posts with the most likes weren’t the ones driving revenue.
It was the quiet compounding posts—the ones that converted steadily over time.
So that’s what I start optimizing for.
How to run your portfolio analysis
This isn’t just a theory—it’s a system you can apply right now.
Just like a savvy investor rebalances their portfolio, you can rebalance your Substack content strategy to double down on what compounds and let go of what doesn’t.
Here’s the basic framework:
Export your post metrics from your Substack dashboard
Create a quadrant chart:
X-axis: Open Rate (%)
Y-axis: Free or Paid Subscribers
Bubble Size: Reaction Count (likes + restacks)
Tag each post as a Dynamo, Rocket, Burner, or Wonder
Build an action plan based on performance
Choose your path
✅ Option 1: DIY with Google Sheets or Excel
Use my free Substack Stats Exporter to download your post data as a CSV and chart it manually with Excel or Google Sheets.
It works great if you enjoy tinkering with spreadsheets. Perhaps you can devise a more effective classification scheme.
Additionally, you gain insight into how to read the metrics. You might develop a different metaphor, such as a farmer who plants seeds and measures the yield in barrels.
🚀 Option 2: Substack Control Center – $25 One-Time
If you’d rather skip the setup and get straight to insights:
Automatically fetches your Substack posts, notes, and subscribers with key metrics
Visualize your entire portfolio with a quadrant bubble chart
Tags your posts by performance (Dynamo, Rocket, Burner, Wonder)
Helps you identify high-leverage stories to optimize or expand
One-time payment. No subscription. No fluff.
It's just a fast way to treat your writing like a compounding portfolio.
👉 Get the Substack Control Center from Gumroad.
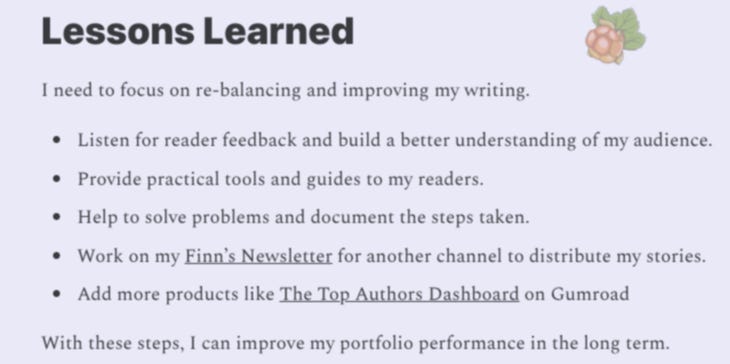
What I’m doing next (and you can, too)
Now that I’ve mapped my Substack portfolio, I’m not chasing new content—I’m rebalancing.
Just like in investing, the goal is to put more weight behind what compounds.
Here’s my 12-month action plan:
Triple down on Dividend Dynamos
Posts that convert consistently are worth their weight in gold.
Republish to new audiences
Spin off related content or micro-products
A/B test CTAs to boost upgrades
Turn Launch Rockets into Dynamos
Virality is great, but without conversions, it’s wasted. So:
Rewrite intros and subject lines for stronger opens
Add clearer value props and upgrade links
Bundle them into lead magnets or onboarding flows
Keep the Slow Burners warm
These posts may not spike, but they show up in the long tail.
Link back to them from newer posts and Notes
Turn them into evergreen onboarding emails
Retire the Wonders (or rework them)
They had a moment. Now they’re research.
Test stronger headlines or reframes
Break them into Notes to spark reactions
Use as A/B testing ground for titles and CTAs
Rebalancing my digital products, too
The same framework applies to my tools.
I’m doubling down on my top-performing products—the ones people keep using and sharing:
Substack Control Center - Portfolio Analytics Tool
Instead of subscriptions, I keep pricing simple, with a low one-time fee.
Why? Because trust compounds faster than MRR.
Price low to build trust, then raise prices as you deliver results.
— Justin Welsh
Want to rebalance your portfolio?
You don’t need a new strategy. You need a sharper lens.
And once you see what’s working, growth becomes obvious.
🧪 Try the Substack Control Center
→ Get the Substack Control Center and rebalance your writing portfolio in minutes, not hours.
I came here just because of the picture to find some meal prep advice 🤣
Turned out it was even better.
I tested it and I think it's very accurate. I don't have any "wonders" and I'm so glad :)) The transparency it provides is amazing. Thank you for doing all these amazing things, Finn! I believe your strategy is solid. And congrats on the sales you made!