

Your Feed Is Lying About Your Notes
It shows hits, not attempts—here’s the labeling + portfolio view that fixes the bug

The Substack feed shows hits. It does not show attempts.
That distortion makes “one viral Note” feel closer than it is.
The truth is simpler: outcomes on social media are heavy-tailed. A few posts carry most of the visible signal. Everything else looks like failure when it is actually the sampling cost of finding who you serve—and who sits one ring out.
By the end of this piece you should have three things:
a visual intuition for why the activity feed lies,
a simple way to label reactions without lying to yourself, and
a small loop you can run for thirty days—plus one concrete way to see your own portfolio instead of the feed’s highlight reel.
In the audience-ring figures—and in my own analytics UI—green means core fit, orange means adjacent / warm, red means miss (scroll-through or no conversion signal). Same hues as the Dynamo / Rocket / Wonder chips in Substack Pro Studio.
Every Note is a draw, not a verdict
Treat each Note (or post, or video) like one random point in a square.
The question is not “Did I hit the center on throw #7?”
The question is “What shape is my target in that square—and how fast am I learning its outline?”
Start with the classic Monte Carlo method picture: throw thousands of darts. The ratio inside the circle estimates something stable. Your publishing cadence is the same idea at a different scale: throughput buys you information.

Honest limit of the metaphor: your audience is not a uniform cloud. You are not literally throwing at random. Skill, positioning, and craft move the effective target.
They do not remove variance. The platform still injects timing, competition, and context you do not control.
So use the Monte Carlo frame for humility about single outcomes, not as an excuse to ship junk.
Green, orange, red — three kinds of resonance
Redraw the board (palette aligned with Substack Pro Studio segment chips: Dynamo / Rocket / Wonder):
Green Dynamo (core): They stop. They signal depth—comments, saves, profile clicks, replies, restacks, or the downstream action you actually want (free subscribe, trial, reply to a CTA). Green is fit, not vanity.
Orange Rocket (adjacent): Something landed, but not identity-level. A like, a quick reply, a shallow save. Enough signal to say “warmer than noise,” not enough to build a whole strategy on one data point.
Red Wonder (miss): Scroll. No memory. No objection—just mismatch or bad timing.
If the green circle is your core Ideal Customer Profile, orange is the adjacent band outside it that still reacts. That band is where a lot of growth hides, because pure green is narrow early on.
Why “viral” is the wrong optimization target
Heavy-tailed social media systems punish planning for the tail. The tail is rare by design. Planning for it turns your calendar into a lottery ticket factory.
What you can plan for:
More informative draws (clear hypothesis per each piece: who is this for, what would “win” look like in 48 hours?).
Faster feedback loops (publish, read reactions, adjust angle—not just “post harder”).
Explicit exploration of adjacent audiences (see below).
If you only count likes, you will chase orange and call it green (core).
On my own publication, ranking Notes by engagement and ranking them by free subscriptions diverge more than it feels like they should—high restacks are not a guaranteed sub win.
Crown a “winner” from reactions alone and you will mis-allocate your next week of effort.
Illustrative tiers (log scale, not gospel)
The GIF below uses illustrative reaction bands to show how rare the right tail looks when you bucket on a log-ish scale. Your publication will have different cutoffs. Treat the numbers as pedagogy, not a scorecard.
Read this strip differently from the “fit” section above: here green dots = high reaction count (the tail the feed remembers), not automatically “good Ideal Customer Profile.” A Note can be green on this strip and still be a conversion miss—that is what the Rocket row in the table later is for.
Red: low signal (“1…10 reactions” in the demo).
Orange: mid band (“10…100 reactions”) —something sparked.
Green: tail (“100-100,000 reactions”) —visible, shareable, often disproportionate reach.
The point is structural: most draws stay left. A handful define what the public remembers.
Your job is not to “skip” the left side. Your job is to learn while the left side is still cheap.
From the metaphor to your portfolio (one way to see it)
You cannot optimize a cloud in your head. You need a portfolio view: your own posted Notes, in a date window, with reach and conversions on the same canvas.
I solved this problem in a tool I wrote—Substack Pro Studio—because I got tired of re-reading the feed to guess what worked.
Disclosure out of the way: if you use something else (spreadsheet, StackContacts export, pen and paper), the job is the same. Sync or import your posted Notes, then look at clicks vs subs together, not either one alone.
Other creator utilities and bundles live on my Gumroad store—same place as Substack Pro Studio if you want the Chrome extension.
Portfolio performance (scatter + medians)
Axes: horizontal axis is clicks (log-scaled so tail traffic does not squash the rest); vertical axis is conversions (free + paid subs from that Note). Bubble size encodes a simple virality sum: reactions + restacks + share clicks.
Median lines split the plot into quadrants so you compare relative performance inside your history—not someone else’s highlight reel.
Deduping: segment counts use one row per distinct note body so reposts or duplicates do not inflate how many “Dynamos” you think you have.
That combination answers two questions the feed never asks: Did this travel? and Did it convert anyone? at the same time.
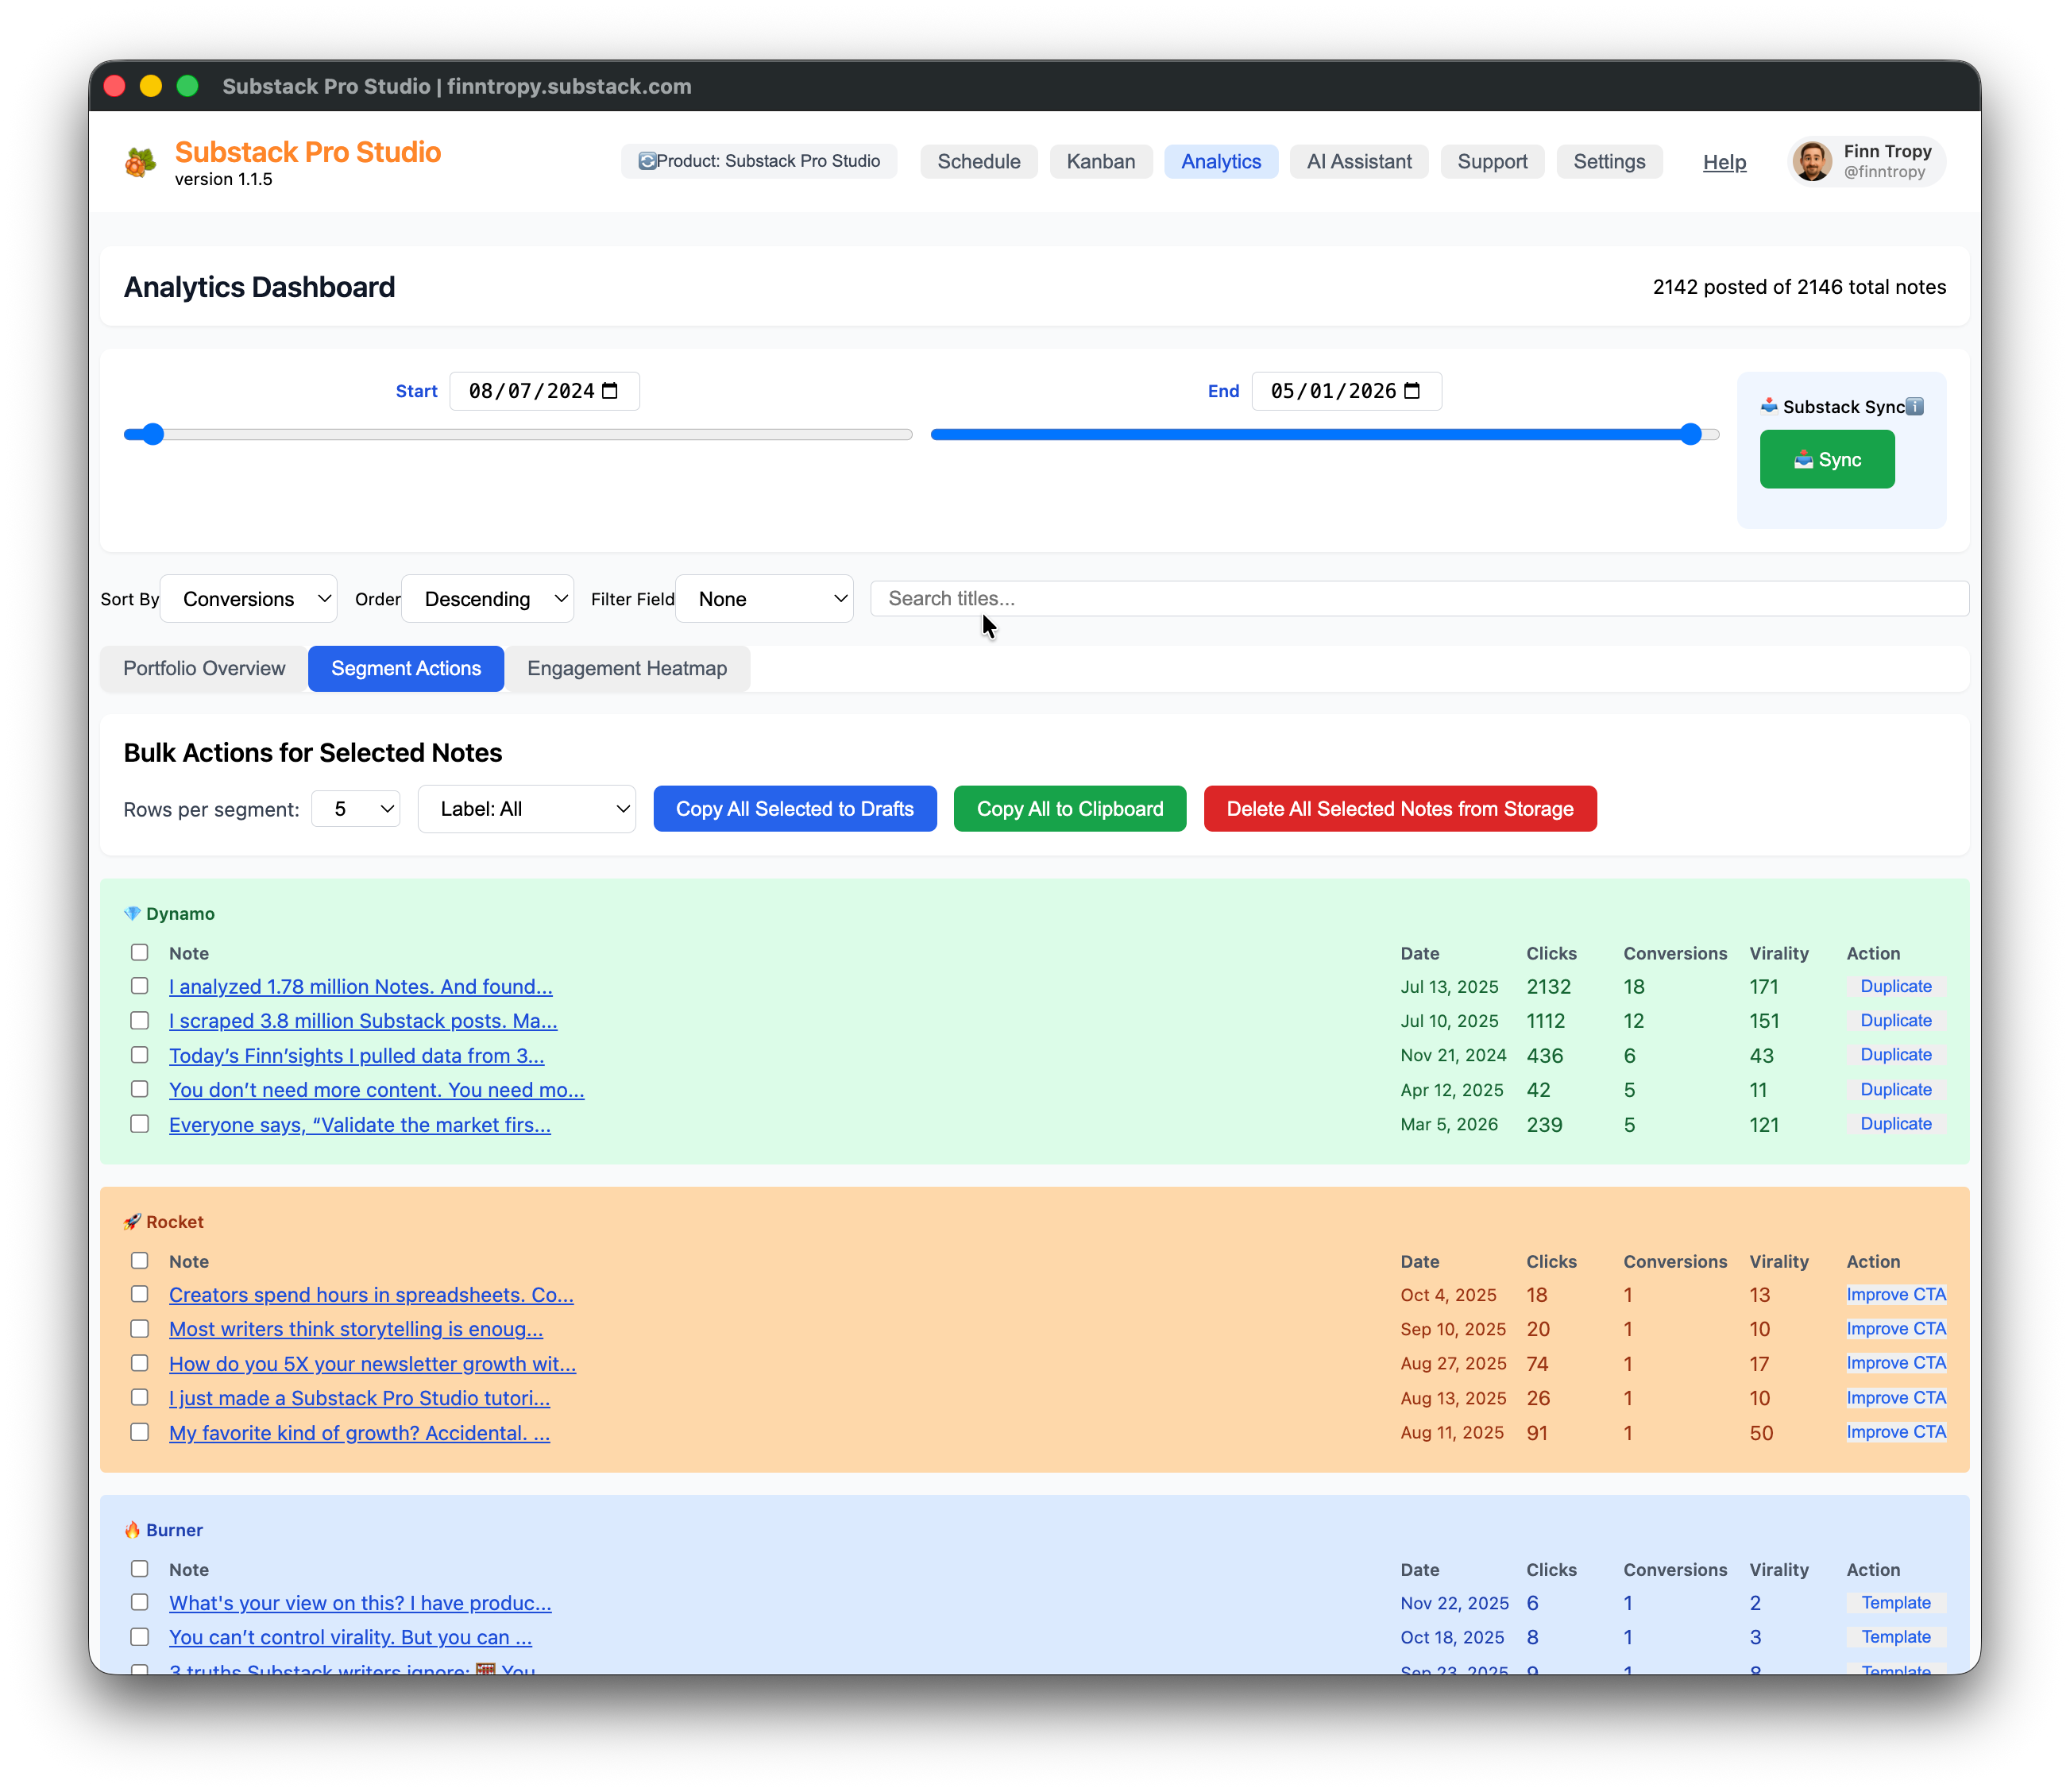
Concrete snapshot from the tool—same story as the Monte Carlo GIFs, but on your data-backed metrics:
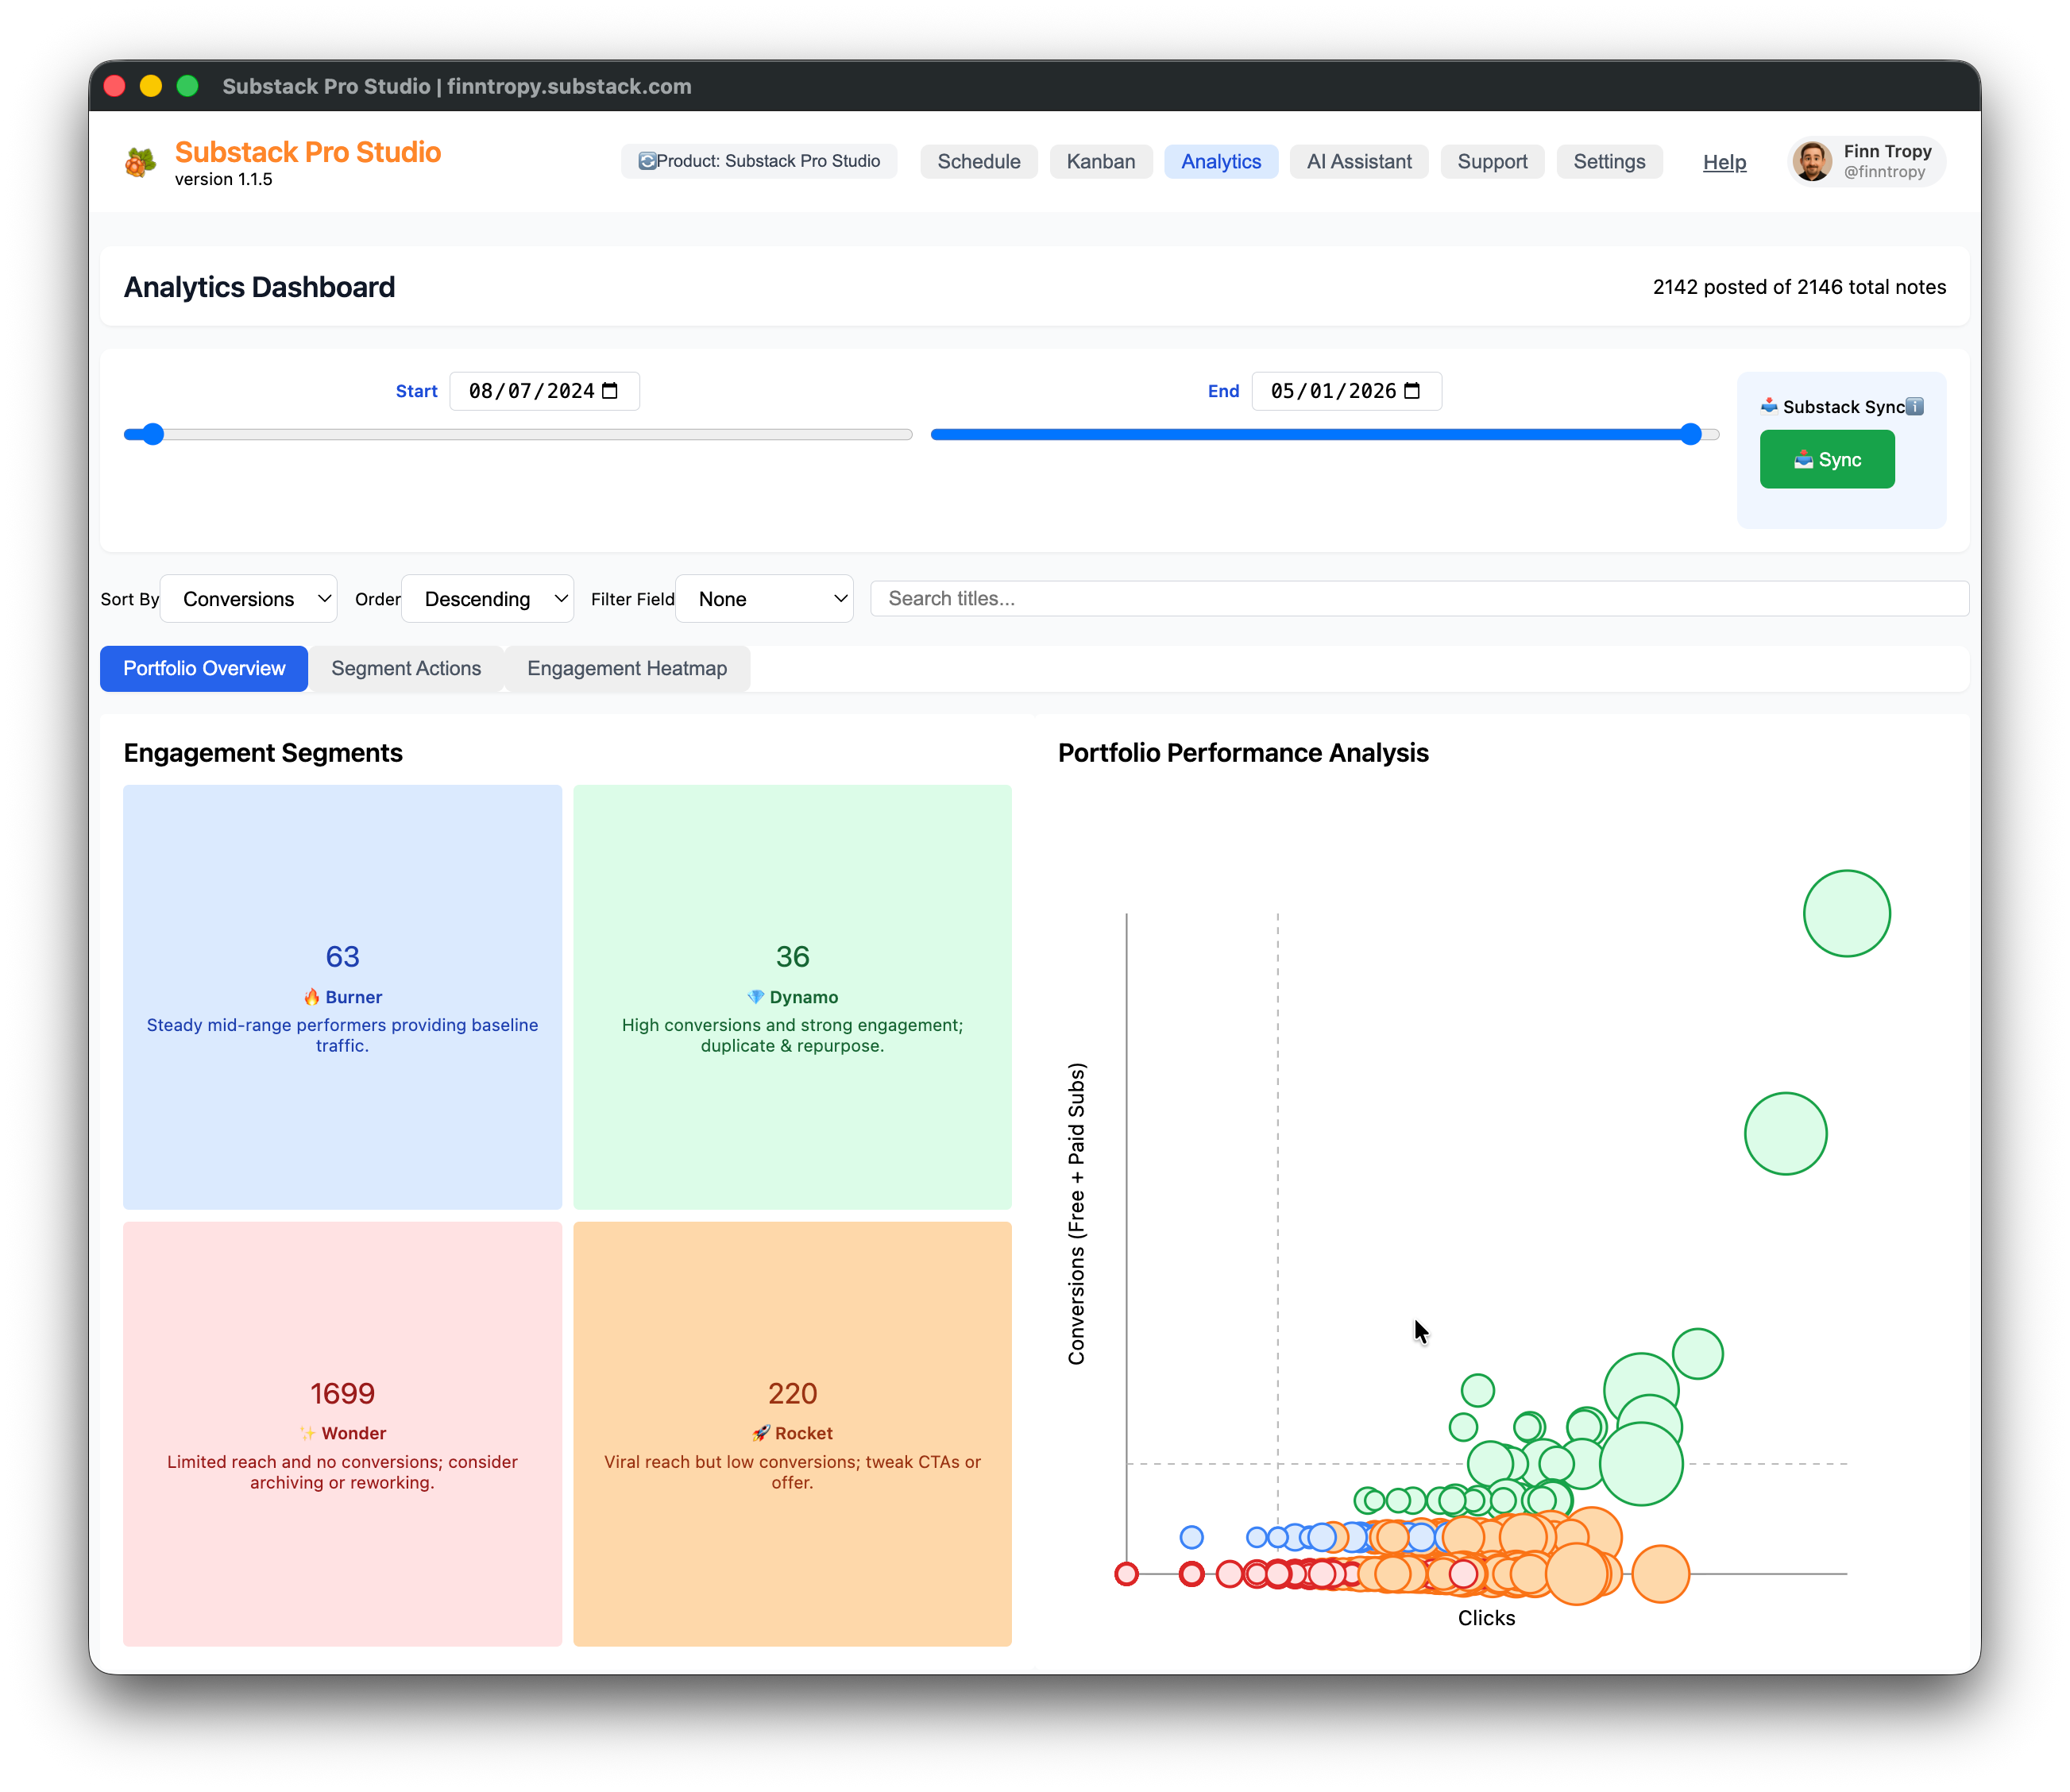
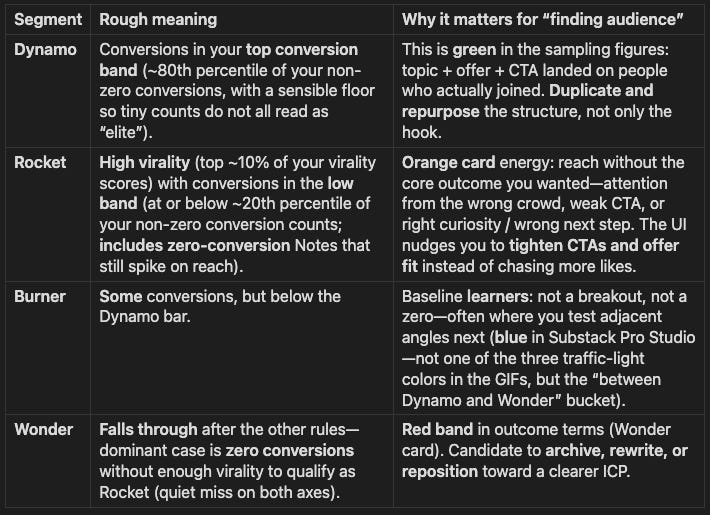
Engagement segments (relative buckets, not fixed “viral” numbers)
Segments are percentile-based within whatever date range you select, so they still work with small number of samples. Priority order matters (a Note is assigned the first rule that matches).
Skim the labels—detail is for when you are in the tool, not for memorizing in one sitting:
So the view is not a report card on your character. It is your circle and your throws—so you can see where orange sits relative to green, using subscribers—not vanity—as the vertical truth.
Segment actions + heatmap (what to do next)
Segment actions: lists per bucket with sort/filter; batch copy to Drafts to run controlled variants; per-row shortcuts align with intent (e.g. push Dynamo clones, improve Rocket CTAs, template Burners into new slots, archive Wonders).
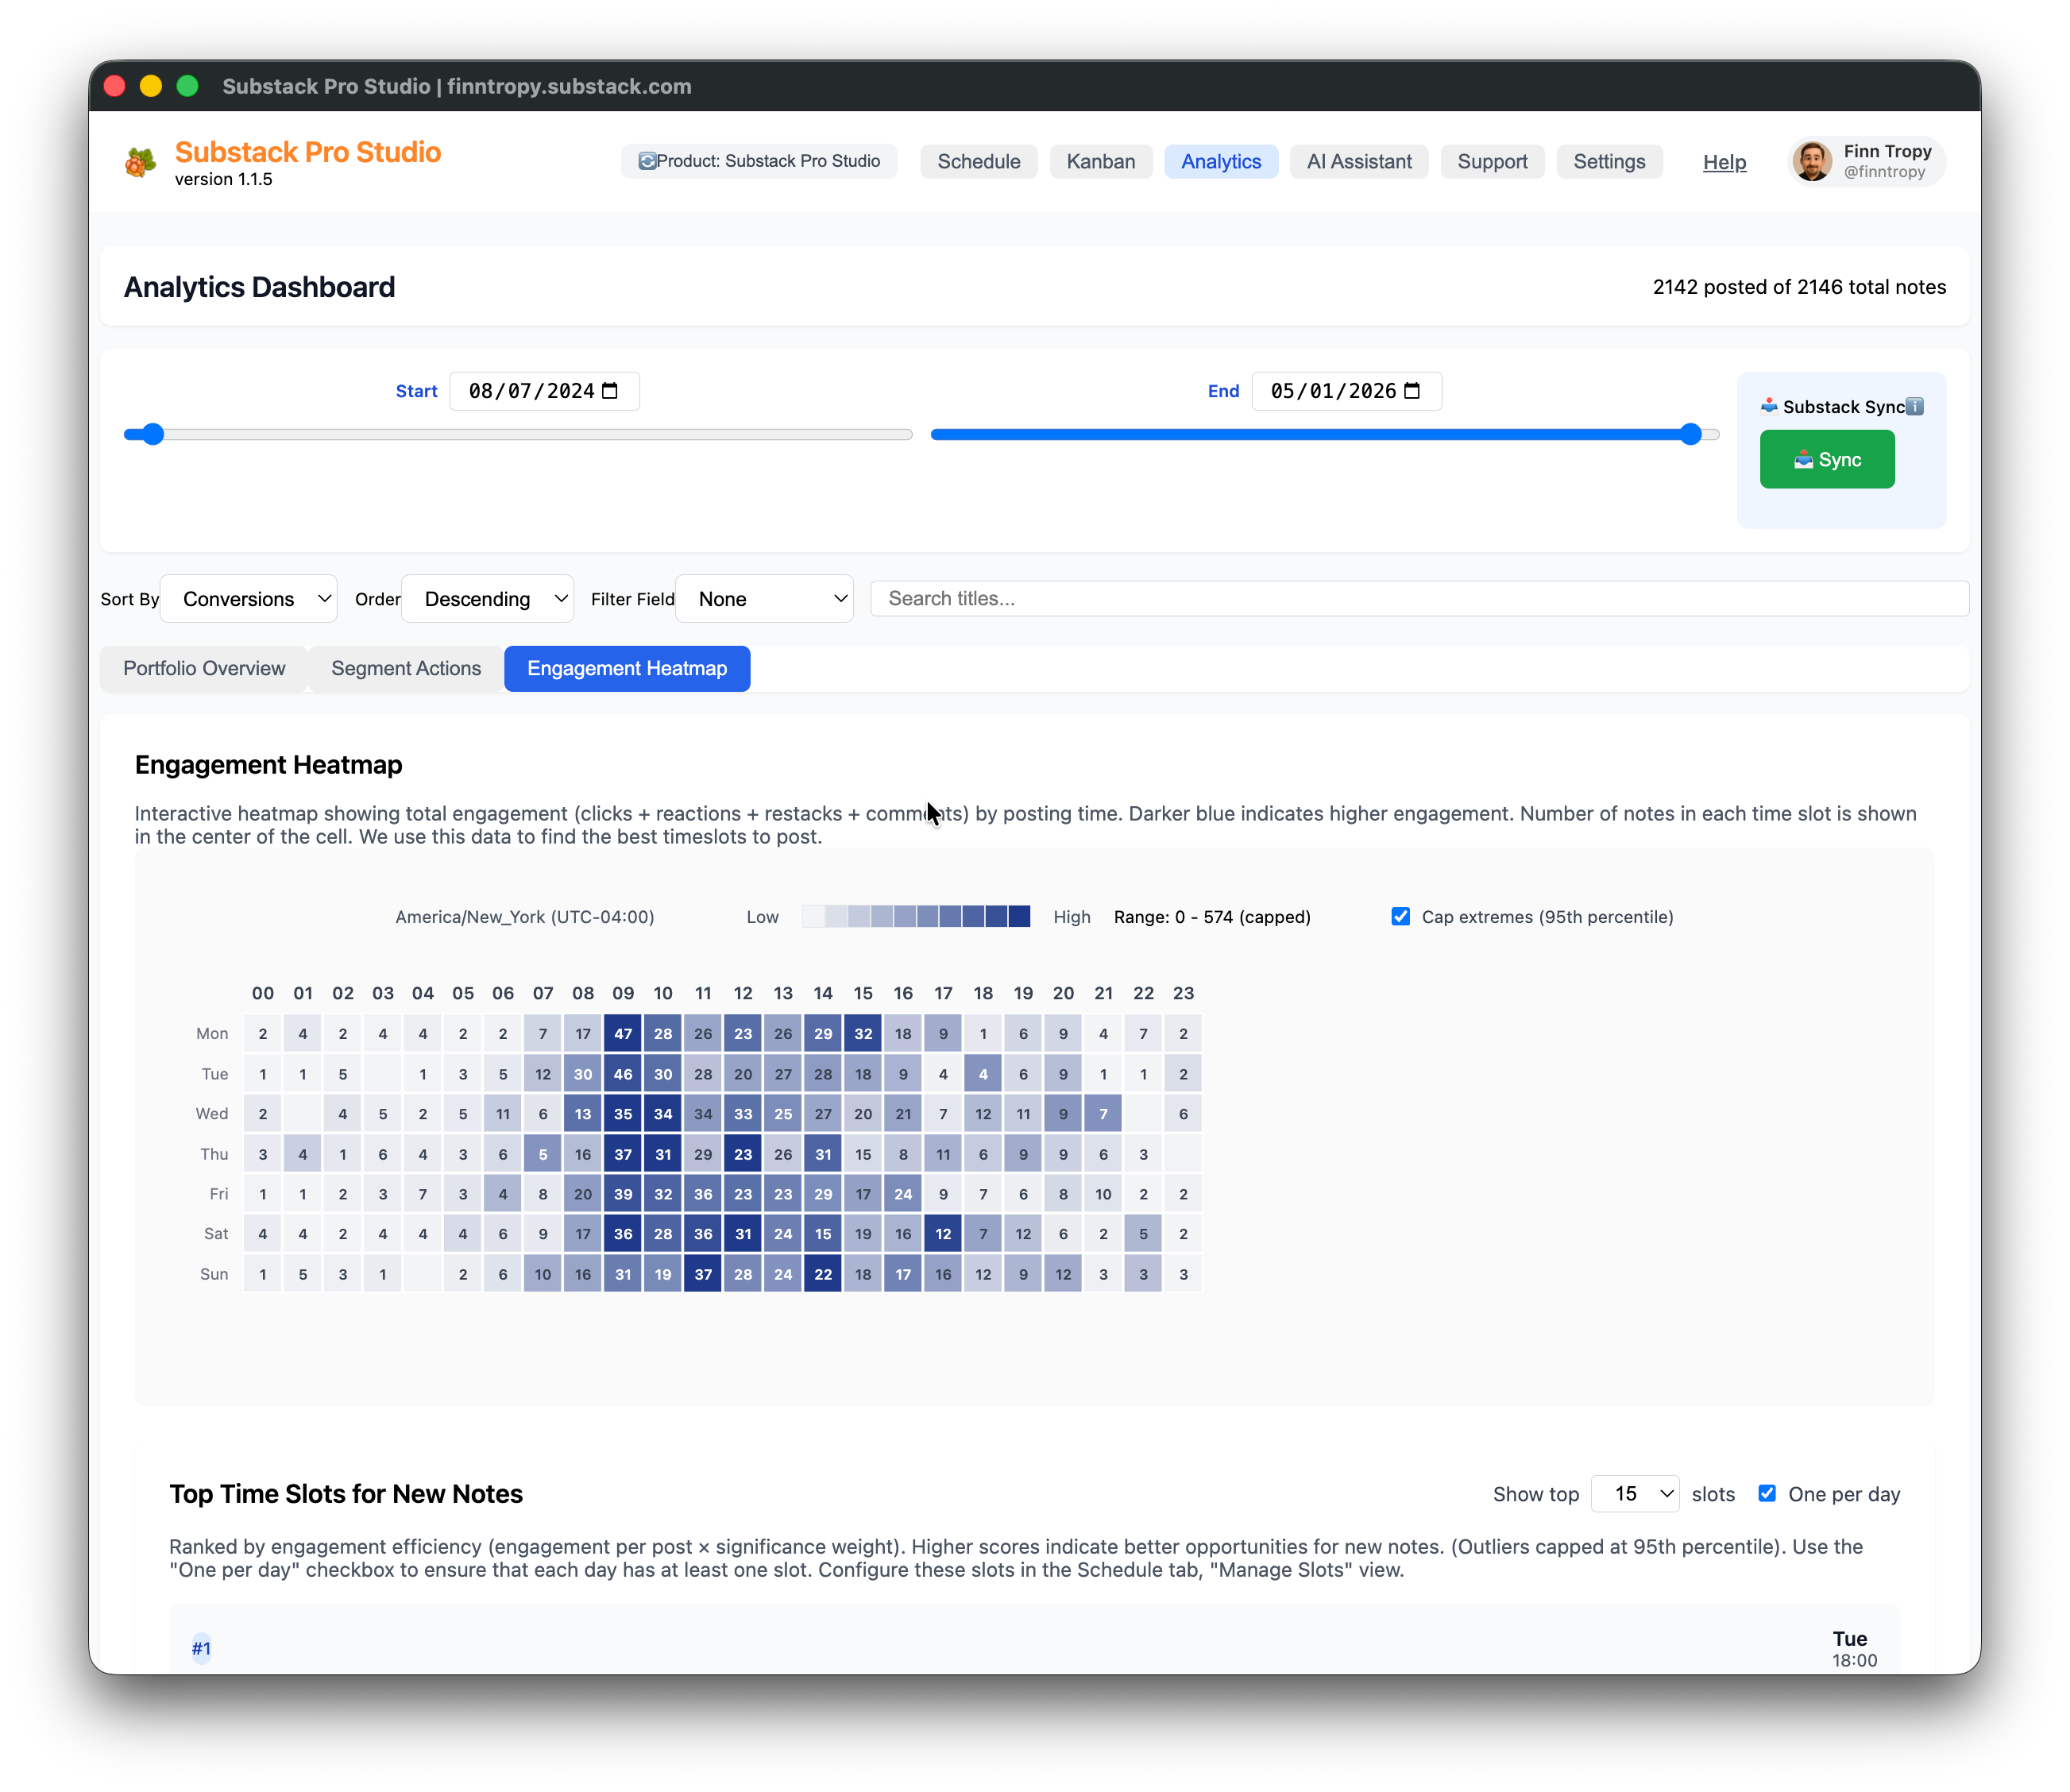
Engagement heatmap: totals engagement by weekday × hour for posted Notes, with optional capping of extremes so one viral outlier does not paint the whole calendar. Top time slots rank slots by an efficiency score (engagement per post, weighted by how often you actually used the slot)—useful when you are exploring timing as part of audience discovery, not only copy.
Better aim widens the circle; it does not delete misses
You have two levers, both real:
Volume / sampling: You discover fit faster when you ship enough varied attempts to map the board. Notes volume does matter.
Craft / positioning: You widen the green region and pull orange toward green—better hooks, clearer Ideal Customer Profile, sharper examples, braver specificity. Notes content matters as well.
The trap is picking only one lever. Pure volume feels brave and burns readers trust. Pure polish without exploration overfits to the last person who praised you.
The point is not nihilism or a hero story. It is writing throughput with honest labels—so one bad week does not get interpreted as proof you were “never good at this.”
How to find adjacent audience in practice
Adjacent audiences rarely arrive with a name tag. You infer them from behavior:
Who restacks without subscribing yet? Topic overlap, not full commitment.
Who comments once and vanishes? Curiosity spike, unclear fit.
Which Notes get likes from accounts outside your usual commenter set? Geography, role, or adjacent tool stack in bios. Recommendations.
Which threads attract “I’m not your reader, but…” energy? That is orange talking loud.
Turn orange into experiments on purpose: same structural beat as a Note that worked, new angle aimed one step sideways (adjacent role, adjacent pain, adjacent workflow).
Log what you tried. Otherwise every orange looks random when it was actually a clue.
A thirty-day loop (small, enough to ship)
Not a life overhaul. A cadence:
Pick one core hypothesis (“This is for X, struggling with Y”) and one adjacent hypothesis (“Z cares about the same outcome, different vocabulary”).
Ship on a schedule you can keep. Consistency here is logistical, not moral.
Tag outcomes in plain language after 48–72 hours: mostly red (miss), orange cluster, any green signal (depth > vanity).
Weekly review: retire one angle that never warmed up; promote one orange thread into a second Note with a sharper example.
One metric you refuse to lie about. If growth is free subs, measure that alongside likes. If growth is replies for research, say so.
No drama. No promise of a million. Just a board that stops lying to you.
Further reading
How Treating Notes Like a Portfolio Unlocked 22% Subscriber Growth in 27 Days
How to Turn Substack Data Into Stories That Grow Your Audience
When Growth Tapers Off: What I Learned From Analyzing My Posts
The Fractal Attention Landscape: How Readers Really Engage With Your Content?
If you know someone who posts Notes every week and still calls themselves “bad at growth,” send them this. They are probably judging a sampling problem with a highlight-reel scoreboard—and a calmer portfolio view might give them their week back.
Subscribers get the same through line: Substack systems, small-N honesty, and tooling that treats Notes like a portfolio instead of a mood ring.
Honest question: Of your last five Notes, how many were mostly red (miss), orange (adjacent warmth), or green (real core-depth signal)—and for one of them, what hypothesis were you actually testing when you hit publish?
— Finn
What a great post! I found you through Kim Doyal. Reading this felt like being back in my stats class, my agency days, and my investing strategy sessions all rolled into one. I'm looking forward to checking out the rest of your tools. This is exactly what Substack needed,,the current tools are average at best
Wow, Finn!
This is the reframe I didn't know I needed.
I've been treating every quiet Note like evidence I'm doing something wrong... turns out I was just judging a sampling problem through a highlight-reel lens.
The orange zone is where it really clicked (those "warm but not quite" signals are data, not disappointment). Going to start tagging my own Notes this week and see what the honest picture actually looks like.
Thank you!