

When Growth Tapers Off: What I Learned From Analyzing My Posts
How I uncovered the hidden patterns behind subscriber growth and churn

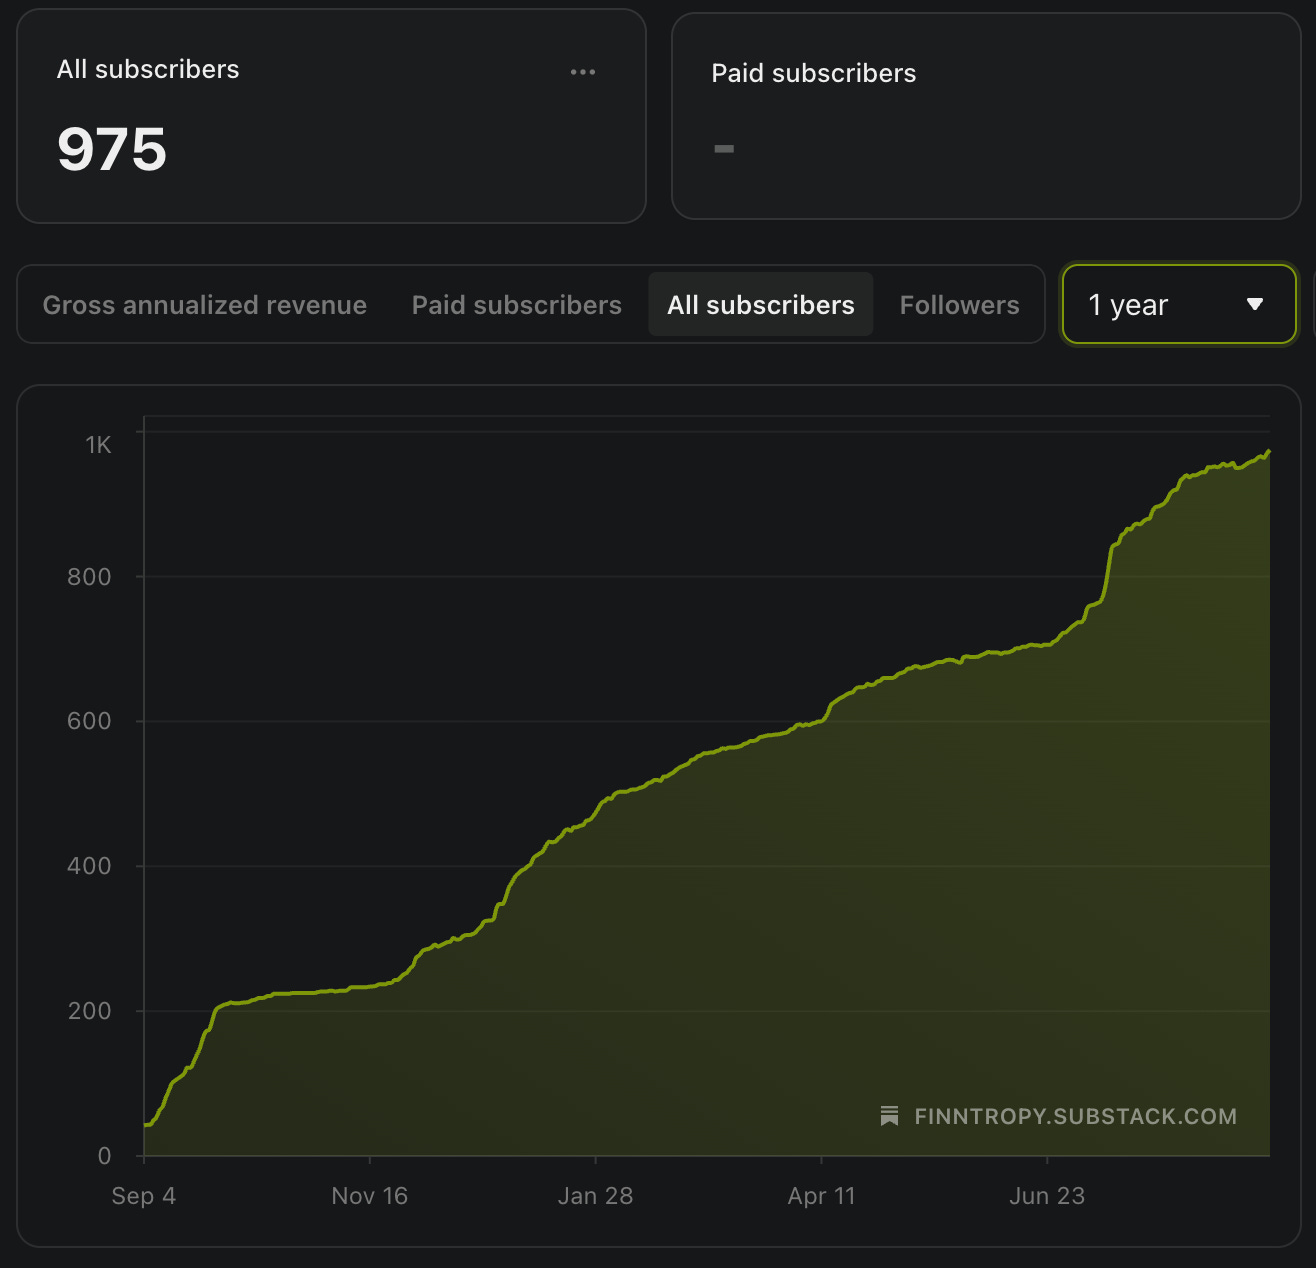
For a while, my newsletter felt like riding a rocketship.
Every new post brought in a fresh wave of subscribers. Engagement was strong, the graphs pointed up and to the right, and I started to think: Okay, maybe I’ve cracked the code.
And then, almost overnight, the momentum slowed.
Not a crash, but a steady taper. The kind that makes you refresh your dashboard multiple times a day to ensure the numbers aren’t stuck.
At first, I told myself the usual story: “Algorithms shift. People get busy. Just keep publishing.”
But deep down, I had this nagging suspicion: maybe some of my posts were helping me grow, while others were quietly pushing readers away.
So instead of guessing, I decided to run the numbers.
And what I found was both eye-opening and honestly a little painful.
Growth Drivers vs. Churn Drivers
Once I lined up the numbers, the patterns jumped out.
The growth posts had a clear theme. They were tactical, how-to guides tied to Substack and Medium mechanics: posting strategies, branding, organization.
Every one of them made a specific promise—and delivered on it.
“How to Learn Who Your Audience Is on Medium” converted 7.4% of readers into subscribers. That’s wild.
“How to Create a Memorable Substack Brand Identity” brought in 10 new subscribers with zero unsubscribes—a perfect run.
Even big posts like “How Often Should You Publish Notes to Grow Your Paid Subscribers?” didn’t just reach thousands—they actually converted at scale.
These posts worked because they gave readers a clear payoff: learn this, try that, get better results. People didn’t just read them—they acted on them.
Then came the churn posts.
These were either:
Personal essays - my philosophical rambles, which I enjoyed writing but maybe a little too much.
Product announcements - include beta launches and “hey, try this thing I built” posts.
Here’s the tricky part: they often got clicks and comments. People seemed engaged. But when I looked at the numbers, they were quietly driving readers away.
“My Quest for a Simple Life Taught Me the Real Cost of Freedom” cost me a net loss of 4 subscribers.
My beta launch announcement? -3 net subscribers.
Even “Welcome to the Plagiarism Party!” sparked conversation, but also sent five people running for the unsubscribe button.
It stung, but the lesson was clear: teaching builds trust and growth.
Abstract musings and hard sells? They push people out the door.
That’s the moment I realized not all posts are equal. Some are subscriber engines. Others are slow leaks.
Turns out, data doesn’t lie - but it does sting a little.
I’ve written about my Posts analysis framework before, and even created a popular analysis tool called Substack Control Center.

However, this time I wanted to dig deeper and really understand what causes churn.
Why do people who have subscribed and received so many articles from me suddenly click that unsubscribe button?
Hidden Data Fields Unlock the Mystery of Churn
After chatting with
who suggested building a new tool for grabbing the Posts’ data as a JSON-formatted file, I discovered that each Substack post had many new metric data fields that I had not paid any attention to before.For the first time, I could see not just subscriptions and unsubscribes, but also signups and disables, including significant “within_one_day” numbers.
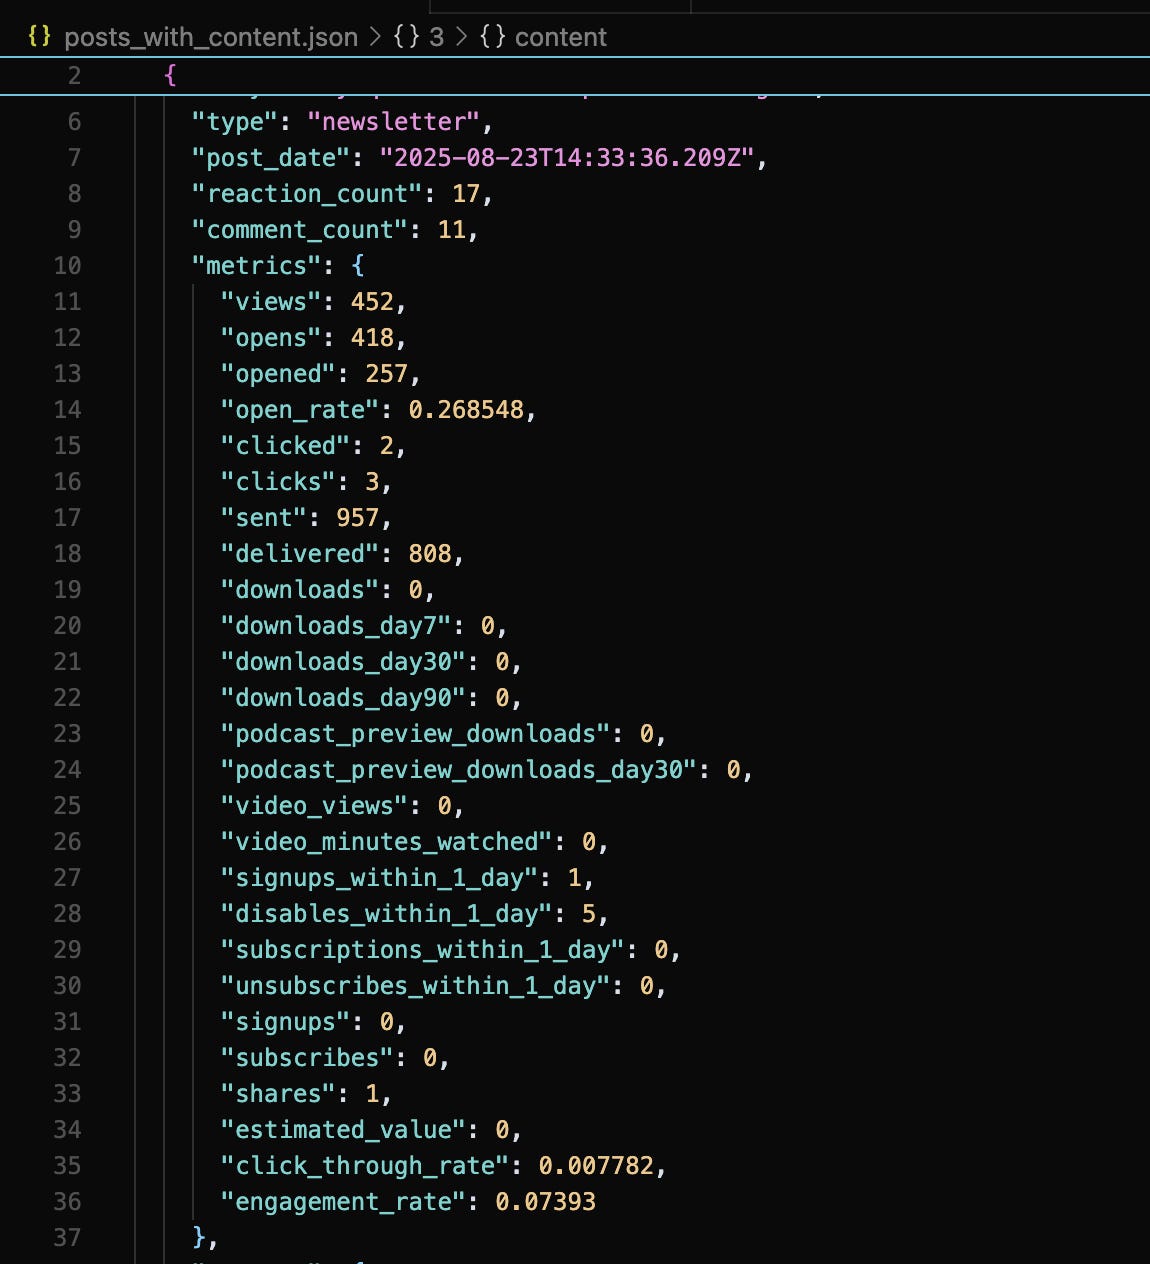
They’re almost invisible in the interface. But put them side by side with your posts, and suddenly the story shifts.
Now I could see not just how many people read a post, but how many decided, “Yes, I want more of this!” versus “Nope, I’m out.”
It was like flipping on a light in a dark room.
All those gut feelings—“this one felt strong,” “that one probably annoyed people”—I could finally test them.
I spent an hour creating a Python program that would classify my Posts by these new dimensions. Here’s the nerdy part (skip down if numbers make your eyes glaze over):
=== Substack Post Performance Report ===

**Overall Statistics:**
- Total Posts: 51
- Total Views: 29,749
- Total Signups (1-day): 177
- Total Disables (1-day): 78
- Net Growth: 99
- Average Engagement Rate: 13.7%

**Top 5 Growth-Driving Posts:**
- How to Learn Who Your Audience Is on Medium (Net Growth: 16, Signups: 17, Disables: 1, Views: 231)
- How To Find Your Optimal Substack Posting Strategy  (Net Growth: 12, Signups: 15, Disables: 3, Views: 739)
- How Often Should You Publish Notes to Grow Your Paid Subscribers? (Net Growth: 11, Signups: 11, Disables: 0, Views: 2,615)
- How to Create a Memorable Substack Brand Identity (Net Growth: 10, Signups: 10, Disables: 0, Views: 166)
- Mastering Note Organization: Unleashing the Power of Supernote to Craft Exceptional Articles (Net Growth: 7, Signups: 7, Disables: 0, Views: 1,519)

**Top 5 Churn-Driving Posts (Lowest Net Growth):**
- My Quest for a Simple Life Taught Me the Real Cost of Freedom (Net Growth: -4, Signups: 1, Disables: 5, Views: 452)
- 🔥 Growth Test for Serious Substack Writers (Beta Open) (Net Growth: -3, Signups: 3, Disables: 6, Views: 594)
- How Do You Measure the Unmeasurable? (Net Growth: -2, Signups: 2, Disables: 4, Views: 443)
- The Most Important Lesson of All — No Writing Survives The Reader (Net Growth: -2, Signups: 0, Disables: 2, Views: 232)
- Welcome to the Plagiarism Party! (Net Growth: -2, Signups: 3, Disables: 5, Views: 780)

**Top 5 Most Viewed Posts:**
- How To Schedule Notes on Substack (Views: 2,686, Engagement: 17.2%, Net Growth: 5)
- How Often Should You Publish Notes to Grow Your Paid Subscribers? (Views: 2,615, Engagement: 33.9%, Net Growth: 11)
- How Often Should You Write to Grow Your Paid Subscribers? (Views: 2,111, Engagement: 22.1%, Net Growth: 2)
- Substack Notes Scheduler User Guide (Views: 2,046, Engagement: 6.3%, Net Growth: 3)
- Mastering Note Organization: Unleashing the Power of Supernote to Craft Exceptional Articles (Views: 1,519, Engagement: 21.4%, Net Growth: 7)

**Top 5 Highest Engagement Posts:**
- How Often Should You Publish Notes to Grow Your Paid Subscribers? (Engagement: 33.9%, Views: 2,615, Net Growth: 11)
- The Investor's Playbook for Writers: How to Balance Your Medium Story Portfolio (Engagement: 29.4%, Views: 161, Net Growth: 2)
- How To Grab Your Medium Earnings to Excel With One Click? (Engagement: 27.3%, Views: 241, Net Growth: 0)
- Hidden Connections Between Medium's Top 12 Authors (Engagement: 26.3%, Views: 79, Net Growth: 1)
- Welcome to the Plagiarism Party! (Engagement: 24.0%, Views: 780, Net Growth: -2)

**Average Performance by Post Type:**
- Newsletter: Avg Views 583, Avg Engagement 13.7%, Net Growth 1.9
Now I could finally see which Posts were creating negative growth.
I thought my essay on freedom would resonate - it felt personal and honest. Instead? Five unsubscribes in one day. That stung.
My Top 5 Churn-driving posts had cost me a net loss of 13 subscribers.
With this data, I wanted to gain deeper insights into growth and churn drivers, as well as some actionable takeaways.
How to Use AI for Growth Analysis
The first time I dumped my posts into AI, the advice was generic fluff.
But after a few days of tinkering, I finally hit on a prompt that actually told me something valuable.
This is what I came up with:
📊 Growth Analysis Prompt

You are an expert in newsletter growth, engagement analytics, and content strategy. I will provide you with performance data from 51 Substack posts.

Your task is to deeply analyze this dataset and provide actionable insights.

Goals:

Identify why certain posts drive growth (signups > disables) while others cause churn.

Suggest how to improve my content to consistently drive higher growth.

Recommend strategies to increase views and engagement across all posts.

Instructions

Please analyze the dataset and structure your response into the following sections:

1. Growth Drivers vs. Churn Drivers

Compare top growth-driving vs. churn-driving posts.

Identify specific themes, formats, tones, or structures that correlate with growth or churn.

Explain why some posts convert readers into subscribers while others trigger unsubscribes.

2. Content Improvement Opportunities

Recommend how to optimize topics, style, structure, and CTAs to reduce churn and maximize signups.

Highlight “content gaps” — topics or formats I should publish more often (or avoid).

Suggest how churn-prone posts could be reframed into growth drivers.

3. Views & Engagement Growth

Suggest strategies to increase visibility (SEO, headlines, timing, distribution).

Recommend techniques to raise engagement beyond the current 13.7% average.

Explain how to convert high-engagement but low-growth posts into signup drivers.

4. Patterns Across Post Types

Evaluate performance by content type (tutorials, guides, personal stories, announcements, experiments, etc.).

Identify which categories consistently bring growth vs. churn.

Recommend an optimal content mix.

5. Actionable Takeaways

Provide 5–7 clear, specific, and actionable steps I can apply immediately to grow my Substack more effectively.

⚡ Use direct comparisons, metrics, and examples from the dataset to back up your recommendations. Include both diagnosis (why something worked/didn’t work) and prescription (what to do next).

Dataset: <paste performance report here>
I won’t post the output here, but I suggest that you run this test yourself.
Copy the prompt above and paste it into your favorite AI tool. Do the same for the Substack Post Performance Report above and submit your request.
Was there anything surprising in the results? Did the recommendations make sense?
During testing, I noticed that my ChatGPT account gave better results because it had my personal history. So if you have used AI to brainstorm new stories or critique your drafts, it has more context that helps AI to make better recommendations.
Why This Matters
The usual advice—“just keep publishing”—misses something important.
Not all posts are equal.
Some formats reliably grow your audience. Others quietly erode it.
If you can see these patterns clearly, you can:
Double down on what works - in my case, more tactical guides, frameworks, and data-backed strategy posts.
Reframe underperformers - turn essays into playbooks, product promos into value-first lessons.
Design your editorial mix around proven subscriber growth drivers instead of intuition.
The difference isn’t just marginal - it’s the difference between sustained growth and stagnation.
A Glimpse at the Future
After pulling this all together by hand, I had one thought: Why doesn’t Substack already do this for us?
Imagine opening a dashboard where, instead of a sea of vanity metrics, you see something simple and powerful:
Posts that brought new readers in.
Posts that drove readers away.
And the patterns tying it all together.
It wouldn’t just be numbers. It would feel like a growth map - highlighting your best-performing work and gently nudging you away from the posts that quietly chip at your list.
No more guessing, no more gut checks. Just clarity.
That’s the next tool I’d like to build. A way for writers like us to instantly see which posts fuel growth, which cause churn, and how to double down on what actually works.
Because if I learned anything from this little experiment, it’s that writing more isn’t enough. You have to know which writing grows your audience - and which writing shrinks it.
Here is what
said after doing this growth analysis:
Takeaway
Subscriber growth isn’t random.
Consistent patterns in your content shape it.
For me, the message was clear:
Actionable tutorials and frameworks = growth.
Abstract essays and promos = churn.
The next step is obvious: keep teaching, keep packaging insights into usable assets, and (ideally) build the tool that makes this kind of growth vs. churn analysis in less than 5 minutes for every writer.
👉 So here’s my question for you: would you use a tool that shows you exactly which posts grow and which ones secretly shrink your audience?
I’m tempted to build it, but only if enough of us want it.
UPDATE Sept 5, 2025
🚀 New in Substack Control Center v1.1.5
Post Performance Report Tab
Not all posts are equal. Some reliably grow your audience. Others quietly drive readers away.
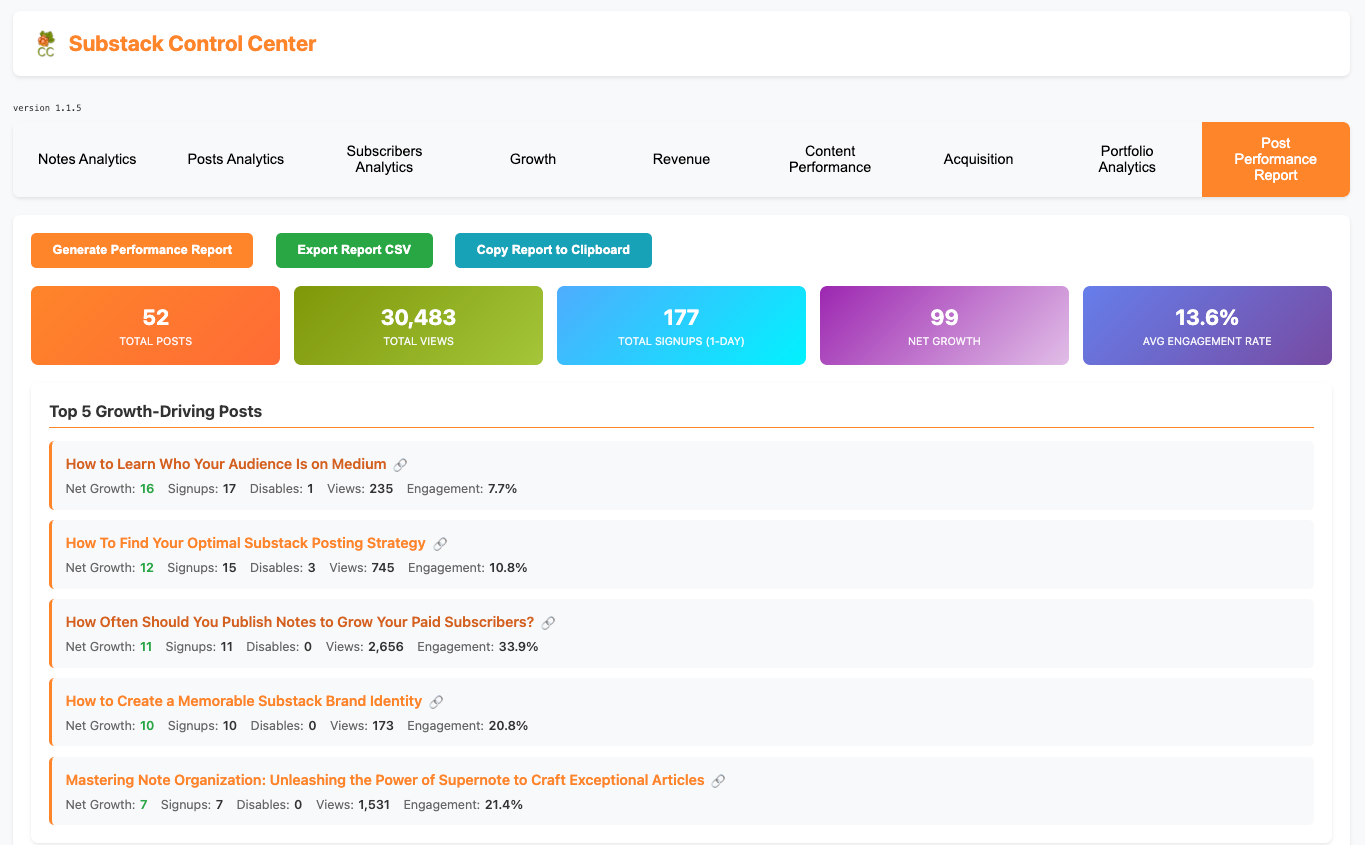
The new Post Performance Report shows you:
📈 Which posts bring the most signups
❌ Which ones cause churn
🎯 Your top growth + top churn drivers
📊 Overall stats, engagement, and post-type averages
Why it matters: you’ll know precisely what to double down on, what to fix, and how to shape your editorial mix for real growth.
Try it today → Load your posts in Analytics, switch to Post Performance Report, and click Generate.
Substack Control Center on Gumroad
What’s your take on today’s topic? Do you agree, disagree, or is there something I missed?
If you enjoyed this read, the best compliment I could receive would be if you shared it.
— Finn
Maybe I'm the oddball. Wouldn't be the first time, But when I unsubscribe via the email link in the post, its almost never a direct indictment of that post. It's more like, I've been thinking of thinning the herd for a while, I rarely read this writer, and today I have the time to do the unsubscribe step.
Other times I do it through settings, who's in here that's just clutter for me? It makes room for some new voices to try. Often I am just 'trying' them to see if I actually read the content.
For me, I don't like video, so if they do video with no transcript, I'm out fast. If they paywall their content too soon, I drop them. Same with paid subs. Often its a trial to see if they say anything I can't live without behind the wall.
So in your case, I subscribed for your tech and data insights on Substack success. And that you create tools. It doesn't bother me at all when you publish a personal essay. It actually builds more connection as long as it's somehow related to your Substack journey, because that's your theme.
I wonder if a more informative analysis might be by client account. How long subscribing, number of posts received, opened, clicked a link, and comment before the unsubscribe. Compare to long time readers. You wont be everyone's cup of tea, but that shouldn't drive the whole content plan. You could try polling the loyal readership when planning to shift, to see if it is something they agree with. You might be squeezing the humanity out of your feed.
Congratulations!!