


You’re Publishing Weekly, But Growth Still Feels Random?
I built a new tool to finally make sense of Substack’s signals - and what I’m launching now


Three months ago, I launched what I thought was my dream project: a dashboard to help Substack writers grow faster.
The idea felt solid. I’d surveyed creators, built a prototype, and filled the first 20 user slots within days. It felt like liftoff.
Then the cancellations came.
And the silence.
Some users left quietly. A few gave vague feedback.
But one email stuck with me:
“I just don’t know how this helps me grow.”
That one line forced me to confront something uncomfortable.
I misunderstood what creators actually need.
What creators really want (and what I got wrong)
Six months ago, I ran a survey on Substack growth and analytics.
Dozens of creators responded, and over 85% said some version of the same thing:
“I want to grow my newsletter into a real business.”

I assumed that meant more data, more charts, more dashboards.
So I built exactly that.
But I was handing pilots more dials, with no map.
I didn’t build a guidance system.
I handed the creators another spreadsheet.
Most of us don’t want to be analysts - we want clarity, momentum, and direction.
What the feedback taught me
As I reread survey responses, a few themes hit me like a splash of cold water:
“I can’t tell which posts are actually helping me grow.”
“I post Notes, but who’s reading them? Do they even matter?”
“The Substack stats are okay, but I feel blind half the time.”
And I knew exactly what they meant because I felt the same.
Substack’s built-in tools are simple, but often too simple:
CSV exports with missing data
No filtering or segmentation
No easy way to connect content with actual growth
No momentum tracking, no real engagement map
So I scrapped the old version. Talked to more creators.
And started over, with one goal:
Help creators make sense of what matters
Introducing Substack Control Center
Your newsletter’s new mission control panel.
Are you tired of guessing what’s working?
Substack creators like you are juggling too many tabs, spreadsheets, and exports. Now there’s a better way to see exactly what’s driving your growth, revenue, and engagement.
No code. No CSV gymnastics. Just one clean Chrome tab, built for serious Substack creators.
Stop Guessing. Start Knowing.
Here’s the pain it kills:
✅ “Which Post or Note actually drove paid subs?”
✅ “Did last week’s thread bring sign-ups or just likes?”
✅ “Am I growing faster than I’m churning?”
✅ “How much MRR will I finish the month with?”
📊 Load It Once. See Everything.
🔥 Growth & Retention
📈 Net-Adds heatmap - green when you’re growing, red when churn hits
⚡ Conversion + churn rates, plus free vs. paid subscriber totals
This view uses data from Subscribers Analytics to calculate a weekly or monthly growth heatmap.
With a glance, I can see that I lost some momentum in October 2024, but I regained it during winter. April 2025 was a strong month, followed by slower growth in May and June.

In weekly view, I can get a more granular view of subscriber growth.
I can see how my 9-to-5 job is interfering with my writing time, as some work days become 9-to-9 or even longer.

💰 Revenue
💸 Live MRR / ARR cards to analyze revenue
📊 SaaS-style area chart: New, Expansion, Contraction & Churn
For those Substackers who have enabled paid subscriptions, this view calculates your current and projected MRR (Monthly Recurrent Revenue), ARPU (Average Revenue Per User), and estimated LTV (Lifetime Value).
LTV assumes a 24-month average retention in the current software version.
You can enter your current pricing (monthly, annual, and founding) or try different price values to see the potential impact on revenue numbers or the trend graph.
Several beta testers with paid subscriptions enabled confirmed that this Revenue view is working well, although one mentioned that it displays approximately 5% smaller ARR than the Substack main dashboard page.

With the paid subscription enabled, you can see the MRR trend and insights tabs.
In my case, I have over 700 free subscribers, but I have not enabled paid subscriptions yet, so my graph looks very flat 😄.
At the bottom, revenue insights show ideas based on your data. For me, at $0.00 per subscriber, I should consider premium tiers—perhaps later this year.

📈 Content Performance
🏆 “Hit List” leaderboard for every Post & Note: opens, CTR, signups, upgrades
🔍 Filter by metrics and all content types to see what converts
This view helps you to identify your best-performing content by different dimensions.
For example, my article, "How Often Should You Publish Notes to Grow Your Paid Subscribers," has generated 62 free subscriber signups so far.
With one click, you can open your story and review why it was so effective.
I recommend spending some time every month reviewing your content performance leaderboard as a reminder of what works best.
It builds your intuition of what resonates with your audience.

You can select another dimension, such as “Shares”. I can see that another article, 'How To Schedule Notes on Substack,' has been shared 49 times, as readers saw the value in spreading my story through their networks.
This is how you can identify possible business opportunities with high word-of-mouth marketing potential.
I built the Substack Notes Scheduler, which is my most successful digital product, and my readers are actively promoting it because they love it.
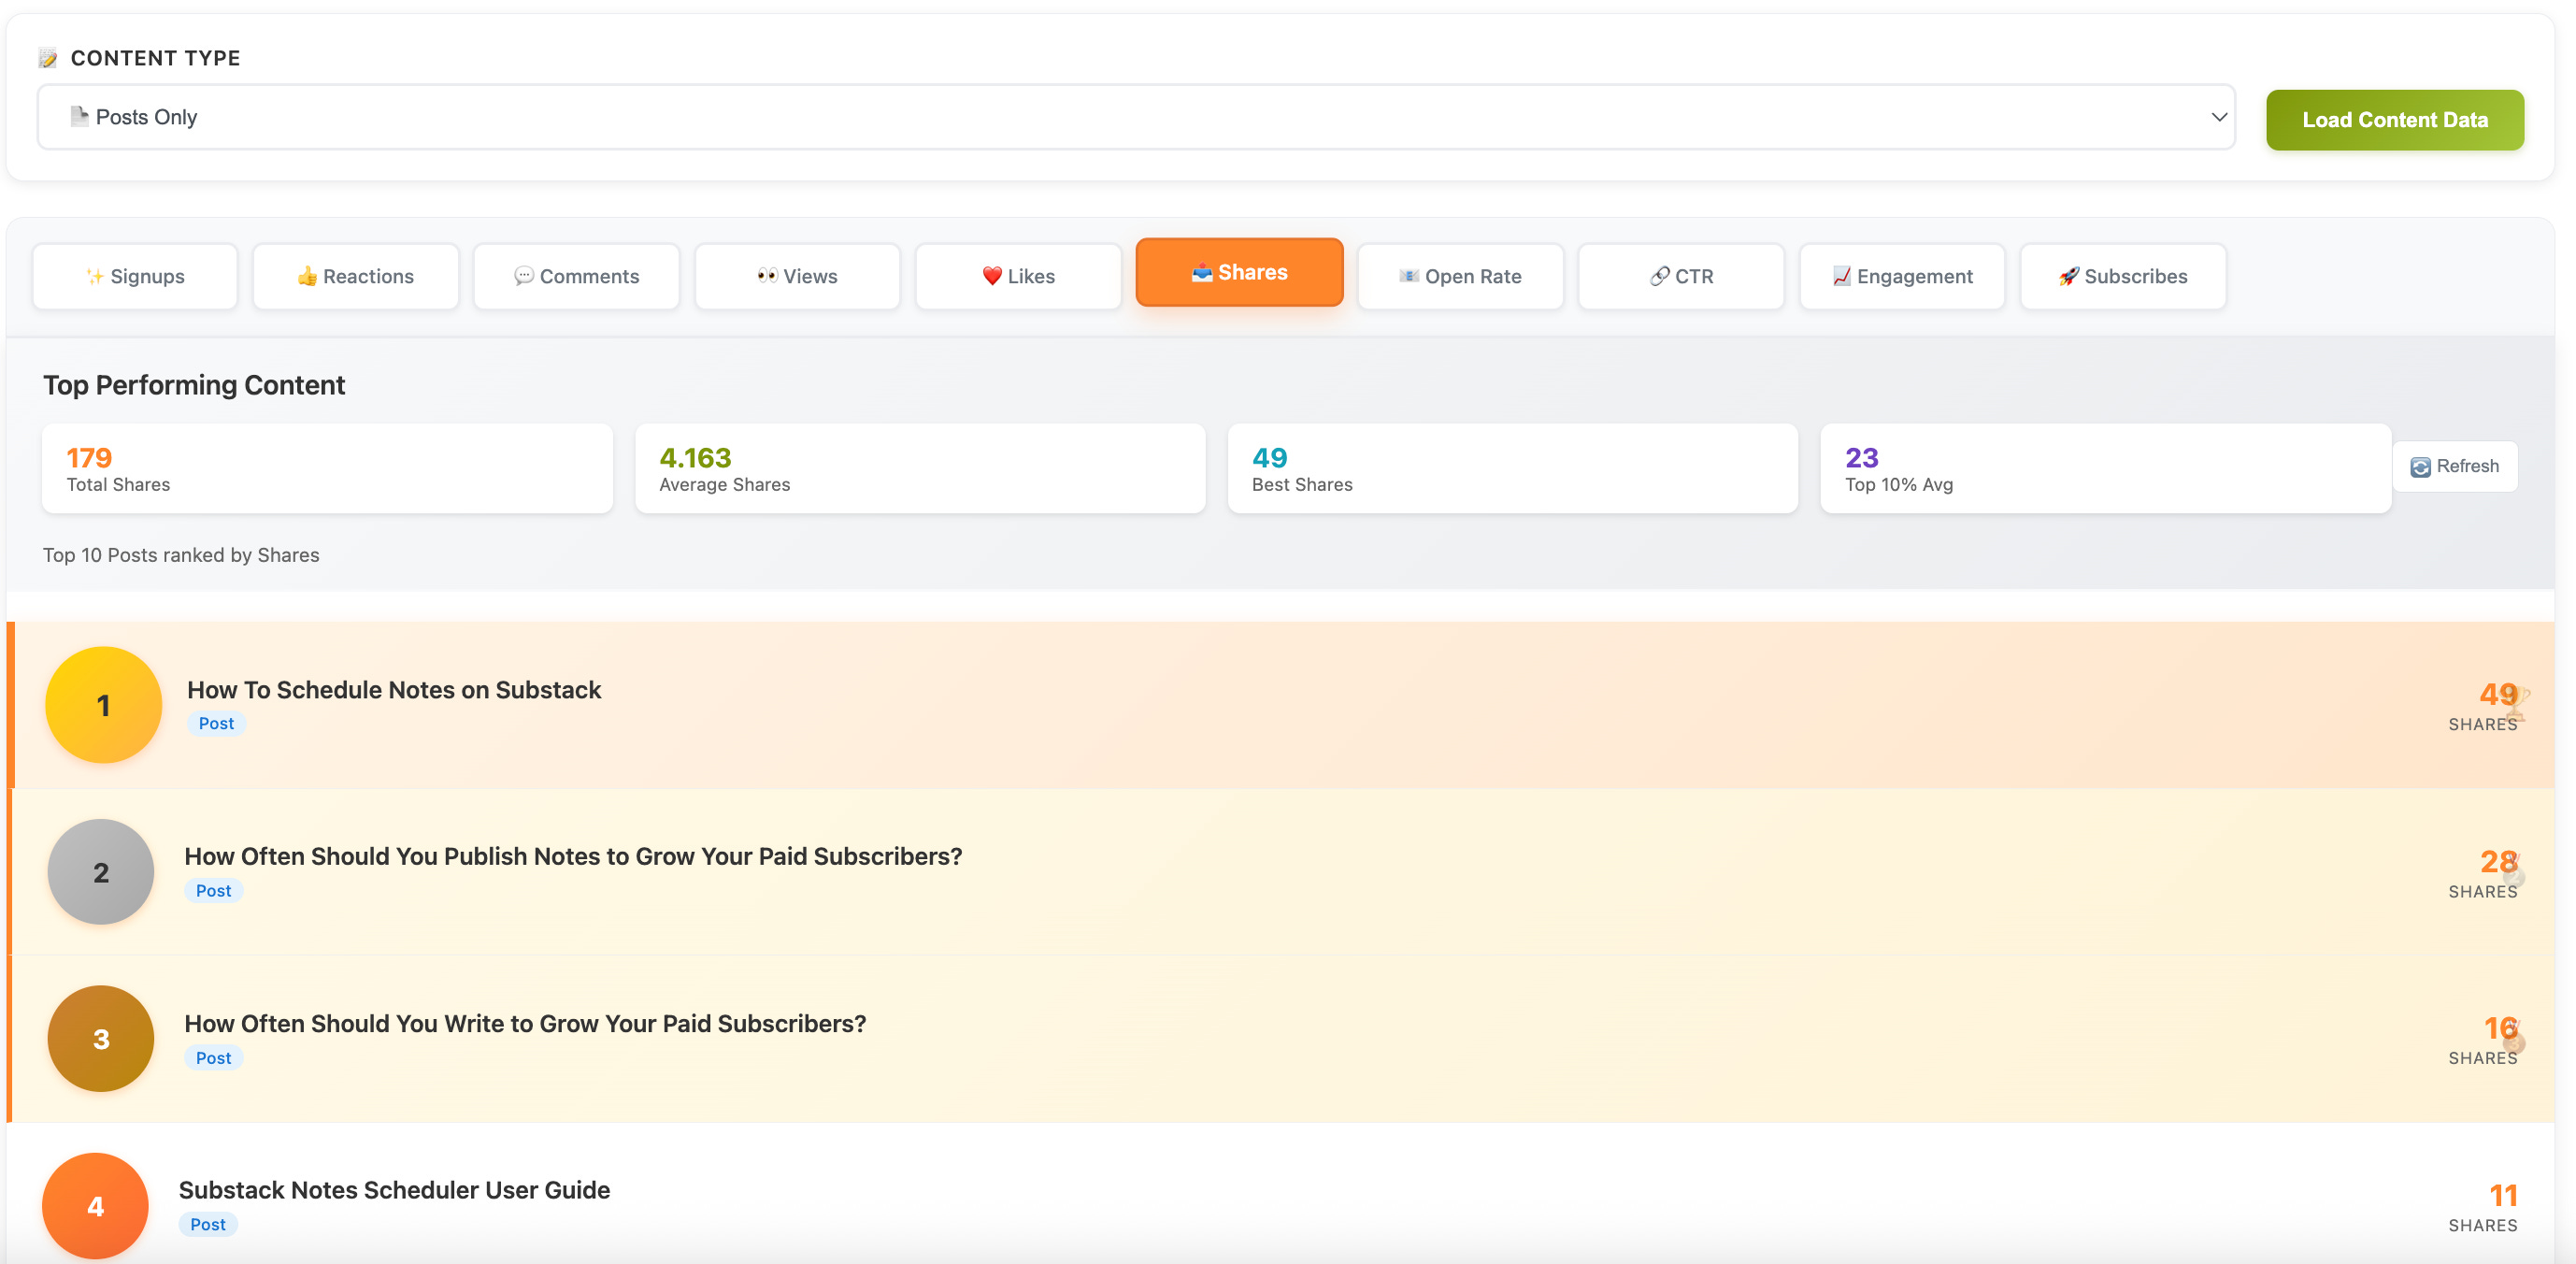
Likewise, with the Subscribers dimension, you can find the posts that brought you the most paid subscribers, so you can review those and write more content on those topics that your audience loves so much to give you money.
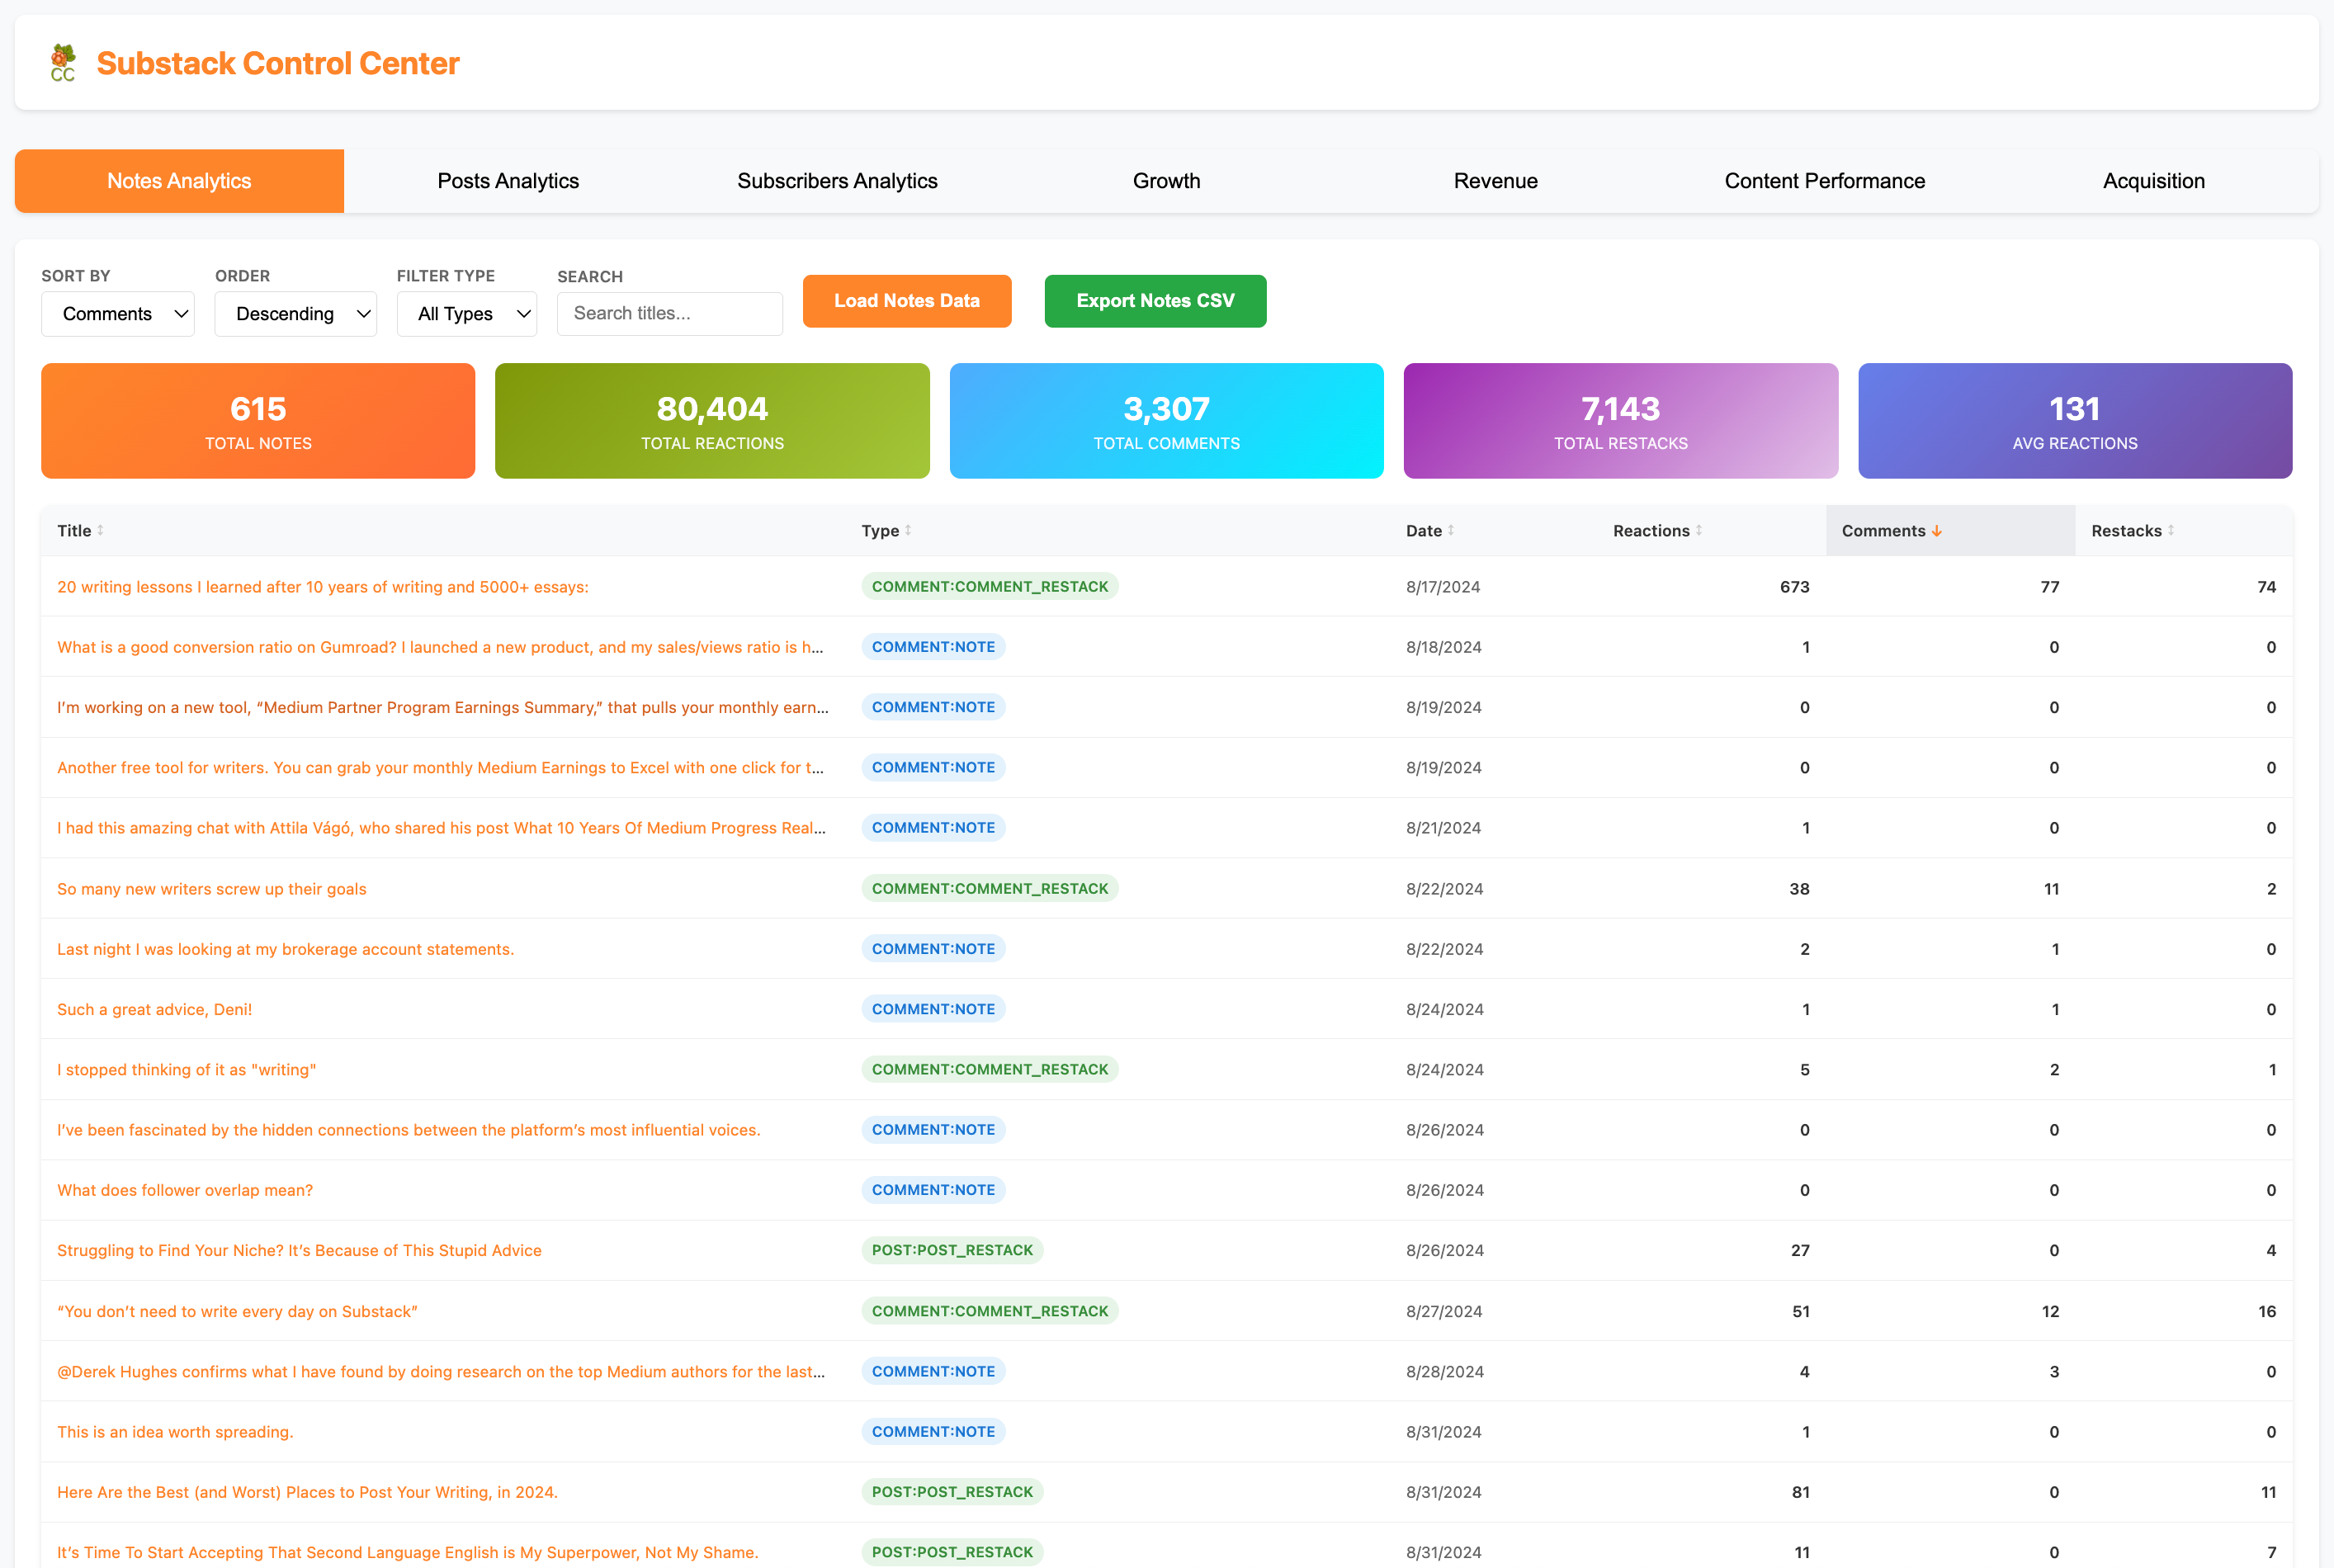
📥 Posts, Notes & Subscriber AnalyticsViews
🗂 Sort by opens, comments, reactions, revenue, activity score
⬇️ One-click CSV export for deeper analysis or sponsor reports
The Notes Analytics gives you access not only to your notes, but also your likes, restacks, comments, and comment and post restacks.
With this 360-degree view of how you interact with other creators, you can discover surprising patterns and finally review those rare gems that you liked, but could never find again on Substack search.
How often did you click a brilliant note, only to kick yourself for not saving it?
Notes Analytics will find all of them, and more.
You can sort, filter, and search your interactions with others, and even export all this into a CSV for your archives.
The Post Analytics view gives you the same power over your posts, but with more metrics to review the performance of your content across multiple dimensions.
Now you can finally see which of your posts bring the most free signups or paid subscribers, and double down on those. Perhaps the call-to-action you used was more effective than in other posts?
You can see at a glance what stories are deemed worth sharing by your audience - this is another signal of value when your readers are doing marketing on your behalf.
This report made me rethink which posts actually matter.
You can use the one-click CSV export for sponsor reports if you are monetizing your newsletter with sponsorships.

And finally, Subscriber Analytics view allows you to sort, filter, and search your subscriber base to understand different segments.
Who are your superfans, who share your stories to their networks?
Who are the most loyal readers, who have read your articles from the start?
Who are your most valuable subscribers over time? How can you reward them?
Who are your most active readers by channel: web vs email?
Who are the most active commenters?
Whatever your criteria for segmentation may be, this view gives you the superpower to organize your subscribers into buckets and create valuable offerings that match their preferences.
Naturally, you can export all this data to a CSV for your archives.

🌍 Works With Custom Domains
When you install Substack Control Center, it will prompt you to enter your Substack URL. There is a built-in test that attempts to use the provided URL and locate your profile.
I have three beta testers with custom domains, and they were all able to get this working correctly using this automated testing feature.

I didn’t want to ship yet another tool
I wanted to build something that gave us back control.
You didn’t start your newsletter to obsess over CSV files.
You started it to build something meaningful - something that grows with you.
Substack gives you the rocket engine.
Control Center helps you to navigate.
To reach the Moon, you need to make minor adjustments along the way, just like the first astronauts who landed there some 56 years ago.
Ready for launch?
If you’re tired of watching other writers grow while you’re stuck refreshing your stats, I see you. I’ve been you.
If you’ve ever wanted real insights - not just raw data…
Then I’d love to have you onboard.
👉 Get early access to the Substack Control Center from Gumroad
Custom setup. Clear insights. Built for creators like you.
Let’s stop guessing.
Let’s grow with control.
P.S. Got questions? Feedback? Just reply - I’m listening.
Purchased and its working great on my machine Finn. This solves a lot of my angst with Substack. I really needed something to passively track my creative flow with my notes and posts. Trying to keep track of all of the performance stats in my head or a spreadsheet was swamping me. Now I can check back at the end of the week to look at the trends, adjust, and get back to spending more of my time creating. Thank you! P.S. thoughts for future versions... First, I could really use a look at the impressions in order to normalize the engagement. If my impressions are low for some reason (time of day posted, # of followers, or algorithm changes) I'd like to have a think about that in the trends. Maybe even have a button to do that normalization. Secondly, I was disappointed when I looked at the output csv and only saw the first line of each note. I could really use the full note text. This would allow me to load the csv to ChatGPT to analyze my writing style vs the engagement metrics. Third, it would be helpful to have a column noting if the note was just text, with photo, or with video so that I can separate out notes by media type and look at their performance.
Just purchased.
Gumroad is such an overlooked platform for digital products.
Surprised Substack didn't try to build something similar to keep people on platform and for them to rake a bit off the top.
Looking forward to trying it.